Download
1 / 18
180 likes | 364 Vues
Global patterns and predictors of marine biodiversity across taxa. Derek P. Tittensor1, Camilo Mora1, Walter Jetz2, Heike K. Lotze1, Daniel Ricard1, Edward Vanden Berghe3 & Boris Worm1 1: Department of Biology, Dalhousie University, 1355 Oxford Street, Halifax B3H 4J1, Canada.

E N D
Global patterns and predictors of marine biodiversity across taxa Derek P. Tittensor1, Camilo Mora1, Walter Jetz2, Heike K. Lotze1, Daniel Ricard1, Edward Vanden Berghe3 & Boris Worm1 1: Department of Biology, Dalhousie University, 1355 Oxford Street, Halifax B3H 4J1, Canada. 2: Department of Ecology and Evolutionary Biology, Yale University, 165 Prospect Street, New Haven, Connecticut 06520-8106, USA. 3Institute of Marine and Coastal Sciences, Rutgers University, New Brunswick, New Jersey 08901-8521, USA. 2010.09.14 정다금
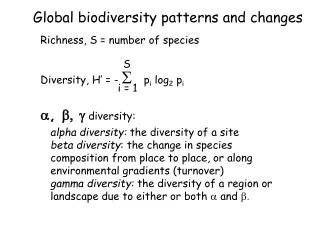
Global patterns of species richness and their structuring forces Ecology, evolution, conservation
Examine: • Global patterns(2-D) and predictors of species richness • across 13 major species groups (zooplankton to marine mammals) • * Coastal species: Western pacific • * Oceanic groups: mid-latitudinal in all oceans • * Spatial regression analyses: • Sea surface temperature • habitat availability and historical factors Patterns Predictors Important: Temperature or kinetic energy, human impacts
Patterns of species richness for Coastal taxa. P R I M A R I L Y C O A S T A L DP Tittensoret al. Nature000, 1-4 (2010) doi:10.1038/nature09329
Patterns of species richness for individual taxa. DP Tittensoret al. Nature000, 1-4 (2010) doi:10.1038/nature09329
Patterns of species richness for individual taxa. P R I M A R I L Y O C E A N I C DP Tittensoret al. Nature000, 1-4 (2010) doi:10.1038/nature09329
Global species richness and hotspots across taxa. 0~1 normalized B-hotspots: Philippins, Japan, China, Indonesia, Australia, India and SriLanka, South Africa, and the Caribbean and southeast USA C-coastal species: Southeast Asia D-oceanic diversity: ~30’ North or South DP Tittensoret al. Nature000, 1-4 (2010) doi:10.1038/nature09329
6 Hypothesis 13 taxa SLM Results Number: z-values *: significance levels
Multivariate spatial linear models (SLMs) 6 hypothesis The kinetic energy or temperature hypothesis: Higher temperature -> increased metabolic rates -> promote higher rates of speciation ‘Productivity-richness’ hypothesis: Extinction or Niche specialist - Better discrimination than onland
3) The stress hypothesis: Negative relationship of richness with environmental stress ( Quantifying the extent of oxygen depletion) The Climate stability hypothesis Higher diversity in more environmentally stable regions Test: using a measure of temporal variance in sea surface temperature (SST)
5) The availability of important habitat feature: • Influence positively both abundance and richness • coastline length for coastal species • Frontal systems for oceanic species (SST slopes) • 6) Evolutionary history among ocean basins • ‘Oceans~’
SST: * only predictor of species richness identified as statistically significant across all species groups in the SLMs * support to kinetic energy or temperature hypothesis (higher metabolic rates or relaxed thermal constraints promote diversity) * supported by minimal-adequate generalized-linear models (GLMs)
SST is the BEST Not supported (2)Habitat 1) (3)Historical Geographic factors 1) Endothermic groups ( cetaceans and pinnipeds) showed stronger positive relationships with primary productivity than SST ( 5.5***, 12.1*** vs. -10.0***, 6.6***) Temperature or kinetic energy has consistent and dominant role in structuring broad-scale marine diversity patterns, particularly for ectothermic species, with habitat(2)area and historical factors(3)important for coastal taxa, and support for other factors varying by taxon
Diversity, SST and human impact overlap. Total Div. Coastal Div. SST and species richness was generally positive (a-c) (except pinnipeds , selective advantage in cold waters) Coastal groups; increase monotonically with temperature Oceanic groups: asymptotic with SST Total s.r ( r = 0.19 , P<0.01) Normalized richness All: r = 0.35 Cs: r = 0.15 Os: r = 0.43 p <0.01 all cases DP Tittensoret al. Nature000, 1-4 (2010) doi:10.1038/nature09329 Oceanic Div. Large human impacts (statistically significant) : coastal areas of East Asia, Europe, North America and Caribbean
Limitation • Limited taxa • Large gap: deep-sea diversity • Microbes or viruses • Limited marine invertebrate data • - Analyze only a subset of mechanisms • that may shape biodiversity
Founding!: 2 distinct patterns of global marine biodiversity *** Coastal habitat taxa vs. Open ocean taxa * Temperature => kinetic energy => Diversity (species richness) over evo & eco * Habitat Limiting the extent of ocean warming Mitigating multiple human impacts
Methods Data collecting: - www.iobis.org and expert Analysis: GLMs and SLMs, Dep-indep. Variables -> log-transformed to linearize and normalize data Excluding: zero diversity, <10% ocean area Maximum likelihood spatial autoregressive (SAR) model Akaike Information Criterion