Download
1 / 23
230 likes | 316 Vues
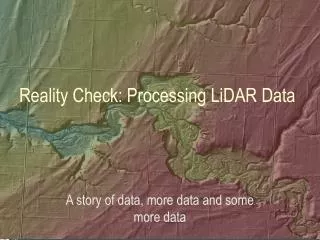
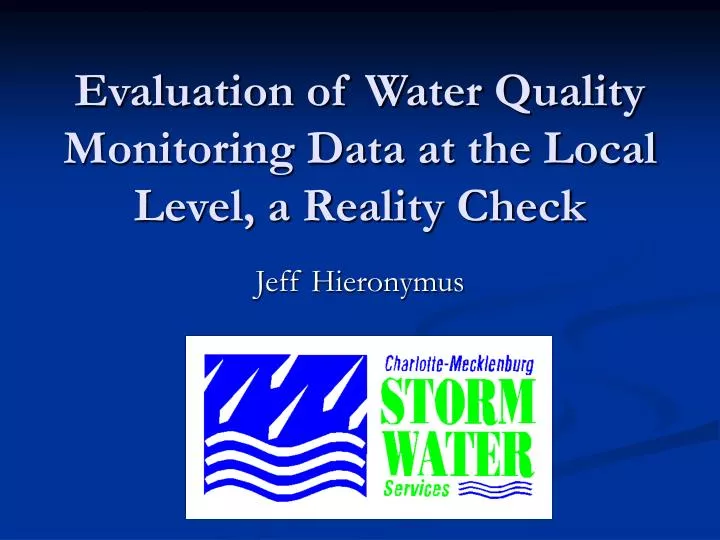
Evaluation of Water Quality Monitoring Data at the Local Level, a Reality Check. Jeff Hieronymus. Mecklenburg County, NC. A Brief History Lesson. September 1969 Water Quality Articles. How do you address odor problems? Use Deodorant. Headwater Streams.

E N D
Evaluation of Water Quality Monitoring Data at the Local Level, a Reality Check Jeff Hieronymus
A Brief History Lesson September 1969 Water Quality Articles
Monitoring Program Objectives • Identify general water quality conditions • Assess effectiveness of program activities and identify trends • Designated Use assessment / TMDL compliance • Pollutant source identification • Support management initiatives
Monitoring Evaluation Goals • Is the sampling program adequate in capturing the full range of flow conditions? • How useful is the program in establishing pollutant concentration and loading trends (assess program effectiveness)? • Should the program be modified to reduce cost and/or increase cost effectiveness?
Flow distribution Analysis • Cumulative frequency distributions were determined for entire flow record • Second streamflow distribution was calculated based on streamflow measured on sampling days • Comparison of distributions assesses whether full range of streamflows are included in data set • Important because bias in streamflow distribution could produce a bias in loading estimates • Stations grouped according to presence of upstream WWTP and whether stormwater samples were collected
Trend Analysis • Important to gage program effectiveness • Time plots of data from all monitoring stations for each constituent was examined for a broad visual assessment • Regression lines were generated indicating the overall change that has occurred with time • Two-sample t-test approach was used to provide an approximation of number of samples required to discern a change in the mean concentration of each water quality characteristic
Program Recommendations • Shift focus of water quality sampling from watershed scale to smaller spatial scale where changes are more likely to be detected • Make additional use of continuous monitors along with flow and water quality measurements to assess creek conditions • Make additional use of water quality information collected by other agencies to assess water quality conditions
Reality Check • Identify general water quality conditions • Stormwater samples needed to capture flow regime • Water chemistry only a part of the story • Public understanding of chemical data • Habitat / visual assessment may be better • Assess effectiveness of program activities and identify trends • Cannot identify trends with current protocols • Number of samples needed cost prohibitive • Potential to move station upstream to project locations where changes more likely detected
Reality Check (continued) • Designated Use assessment / TMDL compliance • State relies mostly on benthic macroinvertebrate data / habitat to assess use attainment • TMDL compliance points at bottom of watersheds • Pollutant source identification • Cannot determine sources at the watershed scale • Support management initiatives • NPDES Permits require data collection • Limited guidance given regarding how to use / interpret data
Questions? • Contact information jhieronymus@ci.charlotte.nc.us 704-336-3927