Download
1 / 9
90 likes | 231 Vues
D/TTAS - Transport policy data needs. Transport Statistics Liaison Group 19 th September 2013. SoS 2011-14 Key Strategies. Maintain road and public transport infrastructure and implement improvements where funding is available

E N D
D/TTAS - Transport policy data needs Transport Statistics Liaison Group 19th September 2013
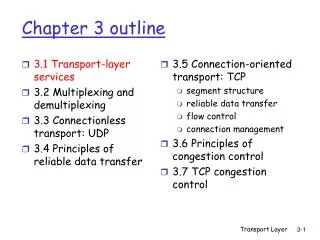
SoS 2011-14 Key Strategies • Maintain road and public transport infrastructure and implement improvements where funding is available • Drive efficiencies and rationalisation in the public transport companies in the context of falling subsidies • Encourage more people out of their cars by improving their experience of public transport through initiatives like integrated ticketing, better stations, better bus stops and real-time passenger information, safe cycling and attractive walking • Maintain the downward trend in road fatalities and injuries • Ensure that our airports and ports provide efficient and competitive support to trade and to tourism
Some KPIs from SoS Related KPIs very much at high level; for example; • Aviation - increase number of routes operating into and out of Ireland by 2014 • Increased passenger throughput at State airports • Less than 200 road fatalities per annum • Maintained or improved journey times and reliability of public bus and rail services as measured by the Quarterly Performance Reports published by the NTA • Trends in public transport passenger numbers, including increased public transport share of total travel as measured by the CSO’s National Travel Survey • Improved accessibility on bus, rail and taxi services.
2008-2011 SOS Goals Previous SoS based on a different mandate • Cut travelling times • Improve safety • Deliver real commuting choice • Reduce congestion • Protect the environment • Perhaps likely that future policy directions could be more in line with these past goals • Policy goals can change – importance of broad measures of progress/improvements
Statistics issues identified 2007/08 • Commuting 25-30% of km demand – no understanding of majority of demand • No national measure of trip volumes, mode share, distances travelled etc. • Commercial demand issues: • High level knowledge through Road Freight Survey – discussion around need for more spatial knowledge, port linkages, foreign vehicles in ROI • Virtually no knowledge of non-freight demand • For all goods/commercial movement issue around being able to quantify associated value of goods (freight, ports& airports) • And competitiveness/costs of commercial transport • Lack of an aggregated demand measure of “vehicle km” • Poor estimates of relative road demand (motorway/national/regional etc.) • Environment & energy statistics and improving link back to fleet & demand • Measure or indicator of “travel times” and “congestion” • Measures of “integration” and “accessibility” • Availability of “spatial planning” measures in transport context
Post 2007/08 improvements • CSO Transport Omnibus first published in December 2007 • Additions to omnibus since then: • Detailed vehicle km estimates by vehicle type, year, month • Public transport flows by time of day etc. • Airport pairings • CSO 2009 National Travel Survey filled major gap • Provided one off picture of key indicators for all trip purposes (trip volumes, mode shares, distances travelled etc.) • CSO National Travel Survey repeated 2012, 2013, 2014 • Environment & energy – improvements in understanding due to vehicle km estimates and emissions standards – but commercial demand remains a problem.
Post 2007/08 outstanding issues? • Freight/commercial demand: • knowledge remains similar, although aggregate vkm figures available • value of goods still regularly raised • “competitiveness” and/or transport costs to industry • “Congestion” • no measure (or definition!) • NTS provides peak/off-peak journey times by mode useful for long term monitoring of travel times • Measuring “accessibility” – • 2009 survey some questions regarding access to public transport and “regular use of a vehicle” • Survey also identified large share of people who did not travel on survey day • Relative road type demand shares (e.g. discussion on importance/ relative value of and demand on regional roads) • Integration • Spatial planning measures
Other data and work Range of other information with national coverage: • National Transport Authority schools surveys, national travel survey 2012, rail survey • AVL information? • National Road Authority road counters • Also NRA road side surveys(?) • Revenue transport fuel statistics • SEAI energy statistics and EPA emissions statistics
Key Issues • CSO transport omnibus essential source of information within Department • But some key policy goals and investments not covered by “statistics”? • Annual capital investment and subvention levels • For example MIU investment of €16bn – statistics to measure outcomes • Is cost of and revenue from transport important (e.g. fuel prices, excise, VRT, public transport fares)? • But need to balance coverage and providing the most important information: • Evolve the CSO omnibus co-operatively • And/or potential merit in high level transport key indicators annual update as early as possible eachyear? • Agreed on importance of National Travel Survey – but type of survey needed and how best to progress co-operatively? • Congestion and travel times will return as key issues – need to measure!