Download
1 / 18
180 likes | 300 Vues
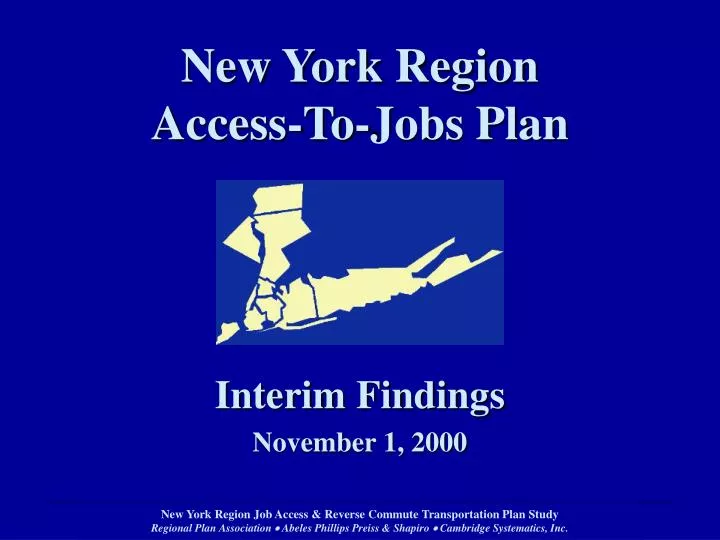
New York Region Access-To-Jobs Plan. Interim Findings November 1, 2000. Information Sources. Inventory of Job Access Activities. Inventory of Transportation Services. Ten Public Meetings. Focus Groups and Outreach Meetings. Initial User Survey Results. NYMTC Travel Survey.

E N D
New York Region Access-To-Jobs Plan Interim Findings November 1, 2000
Information Sources • Inventory of Job Access Activities • Inventory of Transportation Services • Ten Public Meetings • Focus Groups and Outreach Meetings • Initial User Survey Results • NYMTC Travel Survey • New York State Employment Data • Initial GIS Analysis • Literature Research
Participation & Collaboration for Job Access in the Region • Significant increase in interagency cooperation • Some progress on interjurisdictional cooperation • Strong employer interest, variable employer • involvement • Opportunity to more fully integrate job access • with Workforce Investment Act actions
Large Network of Constituents • 270,000 adult TANF/Safety Net recipients • 92% in NYC, 8% in suburban counties • 1 million households earning up to $20,000/year • approx. 75% in NYC, 25% in suburbs • 1.5 million jobs earning up to $20,000/year • approx. 65% in NYC, 35% in suburbans • 61 transportation providers inventoried • 8,500 licensed child care providers
Labor Market Conditions • Labor shortages throughout the region, most • intense where transit is limited • High unemployment and underemployment • persist in many communities • Wage levels have risen slowly in the low-wage • labor market • Skill levels more of an issue for remaining • welfare-to-work clients
Constituency Issues • Welfare-to-Work Clients: • Childcare • Service Cost, Service Hours and Frequency • Safety Net • Low-Wage Workers: • Childcare • Service Hours, Frequency and Reliability • Career Opportunities • Persons With Disabilities: • Span of Service • Service Frequency and Reliability
Constituency Issues • Employers: • Labor shortages and size of labor pool • Employee punctuality • Employee time flexibility • Transportation Providers: • Cost effectiveness • Service flexibility • Human Service Providers: • Labor market and transportation information • Employer involvement
Commuting Thresholds • Commuting times are somewhat higher for low-wage workers, commutes longer than 45-60 affect job retention, depending on wage levels, child care, gender • Wages of at least $10-12/hr appear necessary for longer commutes • Costs above $3/day can be a hardship for lowest-paid jobs • “Trip-chaining” impacted by frequency of service, number of children, work hours
Urban Job Access Issues • Access to NYC Industrial/ Distribution centers • Frequency and reliability on some bus routes • Length of inter-borough commutes • Evening/weekend service • Information on suburban job opportunities • Cost of commuter rail and suburban buses • Safety and familiarity for reverse commutes • Guaranteed ride home
Suburban Job Access Issues • Access to Office and Retail centers • Access to dispersed Retail, Hospitality and Health employers • Lack of transit in low-density areas • Evening/weekend service • Service coordination between different systems • Cost and frequency of commuter rails • Guaranteed ride home
Criteria for Market Selection • Number of Job Opportunities • 1993-1999 Job Growth • Current Transit Service • Potential Transportation Links to Low-Income Communities • Public and Service Provider Input