Download
1 / 23
260 likes | 753 Vues
Lean Demand Management GE Supply Business Meeting Wednesday, January 24 th 7:00pm @ Fermier 303 Free Layne’s Chicken P rofessional A ssociation of I ndustrial D istribution Two Approaches What we want to do Predicting what we must do Supported by the sales force

E N D
GE Supply Business Meeting Wednesday, January 24th 7:00pm @ Fermier 303 Free Layne’s Chicken Professional Association of Industrial Distribution
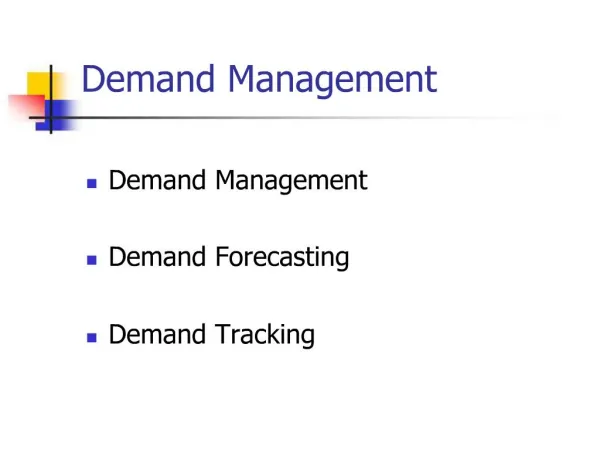
Two Approaches What we want to do Predicting what we must do Supported by the sales force The right customer relationship What the customer really needs Convincing the customer to select the best option for all Predicting what will happen Understanding what must happen Demand Management
Value Stream Mapping • Visually document processes and flows • Explain Processes description and metrics • Helps to redesign processes and identify waste • SIPOC Diagrams
Value Stream Mapping • Determine individual product or service • Draw Process Flows • Draw Material Flow • Draw Information Flow • Collect Process Data and Connect it to Processes • Add Lead Time Data
The Customers are Getting Demanding • Consignment • VMI • Integrated Supply • Outsourced Services • The key is to understand the value provided and how to deliver profitably.
Customer Stratification Model Customer Life OPPORTUNIST CUSTOMERS CORE CUSTOMERS • High Profitability • No Relationship • Low Cost to Serve • Low Volume • High Profitability • Sustained Relationship • Low Cost to Serve • High Volume Gross Margin Cost to Serve SERVICE DRAIN CUSTOMERS UNPROFITABLE CUSTOMERS • Low Profitability • Sustained Relationship • High Cost to Serve • High Volume • Low Profitability • No Relationship • High Cost to Serve • Low Volume Sales Volume
Customer Stratification Model Customer Life OPPORTUNIST CUSTOMERS CORE CUSTOMERS • High Profitability • No Relationship • Low Cost to Serve • Low Volume • High Profitability • Sustained Relationship • Low Cost to Serve • High Volume Gross Margin Cost to Serve SERVICE DRAIN CUSTOMERS UNPROFITABLE CUSTOMERS • Low Profitability • Sustained Relationship • High Cost to Serve • High Volume • Low Profitability • No Relationship • High Cost to Serve • Low Volume Sales Volume
Moving Service Drain Customers to Core Moving Opportunist Customers to Core Quickly Eliminating Unprofitable Customers Developing the Relationship with Core Customers Managing Customer Relationships
Inventory Holding Cost Components Insurance & Taxes Inventory Holding Cost Cost of Capital Storage Cost Obsolescence Cost
Inventory Stock-Out Cost Components Back Orders Inventory Stock-Out Cost Buy-Outs Lost Sales Expediting
Total Saving – Costumer Calculator All Savings are expressed as a % of annual cost of purchasing from distributors 70 63.39 60 54.18 49.46 48.52 50 40 34.44 30.43 32.33 26.57 PERCENTAGE SAVINGS 21.85 30 23.83 20 10 13.47 11.25 2.77 4.18 1.44 3.94 6.13 5.84 4.68 2.95 0 1 2 3 4 5 6 7 8 9 10 CASES
Transportation Inventory Sales Effort Managing Cost and Customers Simultaneously How Do You Increase Service without Blowing Costs Sky High?
New Products – Insufficient historical data Solution: Demand duplication technique Substituting history of similar product Forecasting – Data Integrity Issues Item introduced in Oct ‘01
No or Negative Demand – Lost sales Solution: Demand averaging & duplicating technique Forecasting – Data Integrity Issues Average of Jun’02 and Sep ‘02
Biased and Negative Forecasts Due to use of just one year of demand history Forecasting – Data Integrity Issues
Seasonality problem for repeated sales pattern Solution: De-seasonalize the demand Biased forecast for repeated sales pattern Forecasting – Data Integrity Issues
Outlier reflected in forecast Outlier smoothed after modification Forecasting – Modifications to Math Model
Combination Forecasting & Error Metrics Demand History Math Model System Forecasts Amended Forecasts Combination Forecasting Error Metric Actual Demand