Download
1 / 41
410 likes | 965 Vues
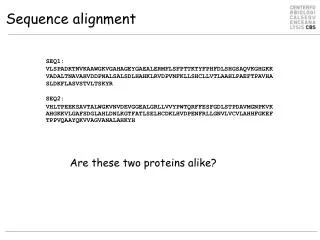
Sequence Alignment. Sequence Alignment. Why: To match a new sequence to others with known functions To search for ESTs and other signs of gene expression To understand population dynamics and evolutionary relationships between genes and species To find important regions within proteins

E N D
Sequence Alignment • Why: • To match a new sequence to others with known functions • To search for ESTs and other signs of gene expression • To understand population dynamics and evolutionary relationships between genes and species • To find important regions within proteins • Issues: • Alignment should mimic evolutionary descent: the actual history of mutation and selection that led to this gene • But it is too complicated to get perfectly correct • Protein alignments work over larger evolutionary distances than nucleotide • How to treat substitutions, insertions and deletions (gaps) • How to score possible alignments • Global vs. local alignment • Multiple alignment (as an extension of pairwise alignment • Hidden Markov Models and other ways of abstracting multiple alignment information • Homology: related by evolutionary descent. As opposed to similarity, which is not necessarily based on descent from a common ancestor • But in practice, long aligned sequences seem to only arise by evolution • Short alignments can be due to chance or convergent evolution.
Example Alignments • THISSEQUENCE vs. THATSEQUENCE • Same length, just 2 mismatches • THISISASEQUENCE vs. THATSEQUENCE • Length is different, need to introduce gaps to maximize identities.
Scoring by Identity • One simple way to score an alignment is by counting the number of perfect matches. • Get percentage of identities by dividing number of matches by total positions (including gap positions). This is a measure of relatedness between 2 proteins. • For previous example, 11 matches with 16 positions = 68.75% (69%) identities • Length matters: it is harder to get a high percentage of identities in a long sequence than in a short one. • Problem of random matches. For nucleotides, 25% of all positions in random sequences match, and it’s 5% for proteins. • General rule, based on proteins with known structural similarity: • Two proteins are probably structurally similar (and thus probably homologous) if they have 30% or more identical amino acids over their whole length when aligned. • Less than 20% amino acid identity means probably not homologous • Between 20% and 30% is a gray zone • My personal happiness with matches increases when it’s above 35% • Except for very unusual proteins, 100% identity doesn’t occur between homologous proteins in different species
Dotplots • Dotplots are a simple way of seeing alignments • We really like to see good visual demonstrations, not just tables of numbers • It’s a grid: put one sequence along the top and the other down the side, and put a dot wherever they match. • You see the alignment as a diagonal
Dotplot Noise • A big problem is noise: there are lots of random matches (roughly 5% for proteins) that confuse the image. • Standard solution: create a sliding window (say 10 residues) and only mark a dot if a minimum number of matches occur in that window (say 3). • A lot of noise goes away • This is a sequence compared to itself, so there is a perfect diagonal.
A Real Dotplot • Two haptoglobin sequences. (Haptoglobin is a blood protein that binds to hemoglobin that has gotten out of the red blood cells). • You can see a gap in one sequence, a region of poor similarity just before it, and a simple sequence repeat near the beginning.
Similarity Matching • In proteins, many substitutions occur that have little effect on structure or function • or, they alter the protein to make it more adapted for the lifestyles of the different species • This depends on where in the protein they occur and on the chemical and physical properties of the amino acids. • Substitution matrices: scores of the probability of changing one amino acid into another. • Amino acids are similar if they can frequently be substituted for each other. • These are just overall numbers compiled over many sequences, not adapted to specific cases. • Early attempts were based on amino acid properties, or on the number of nucleotide substitutions needed to change from one amino acid to the other. • Now they are based on actual comparison between sequences. • The two most popular types: PAM and BLOSUM • There are other, more specialized substitution matrices, for comparing transmembrane regions, for example.
Similarity Matrix Theory • Think about aligning 2 proteins from similar species that are orthologs: same function and syntenic. At some point back in evolutionary time, there was a single DNA sequence that is the common ancestor of both proteins. • Most paired amino acids are identical, but a few are different. • Reduce the problem: consider a single aligned pair of amino acids, that are not identical. T-S • We are comparing 2 theories of how these amino acids were derived from a common ancestor. • Random mutation followed by natural selection. Some substitutions will happen more frequently than others because they lead to functional proteins more often. • The frequency with which T and S are substituted for each other by evolution is derived from counting them in well-aligned sequences. = freq(T-S) • Completely random changes: every possible substitution happens in proportion to the relative frequencies of the different amino acids, the two amino acids are unrelated to each other. • In this case, the frequency of a T and an S is just the product of the frequency of T’s and the frequency of S’s in the entire protein (or proteome). -= freq(T) • freq(S) • The odds ratio is the evolutionary theory (observed data) frequency divided by the random theory frequency. OR = freq(T-S) / freq(T) • freq(S)
More Theory • We want to get the odds that a given alignment fits the evolutionary model better than a random model. • Good alignments give high odds ratios • Need to multiply the OR’s for all amino acids in the alignment • It is easier (and doesn’t overflow the computer’s floating point calculator) to take the logarithm of the odds ratio for each amino acid, and then add the logarithms. • This is the lod score (log of odds). • A negative score means that the given substitution is less likely than chance, and a positive score means it is more likely than chance. • You can score each possible alignment by adding up over the whole protein • Some fooling with constants (which don’t distort the results but are either more pleasing to the human eye or make further calculations easier: multiply lod score by 10, or add a constant to make al values 0 or greater
PAM • PAM = “Point Accepted Mutations”, meaning single amino acid substitutions (point mutations) that have been “accepted” by natural selection: they are functional in different species. • Derived by Dayhoff and colleagues in the 1960’s and 1970’s (although there are some newer versions around) • They give a measure of the frequency of changing from one amino acid to another, as compared to the frequency of random change • Derived from global alignments of homologus sequences from different, but closely related, species. The sequences had an average of 1 amino acid change per hundred residues. Thus we assume at most 1 mutation has occurred at each position. • Do an phylogenetic analysis of the sequences to determine which mutations have occurred • Calculate the lod scores. Then multiply all of them by 10 and round to integers. • This set of scores derived from sequence alignments is the PAM1 matrix. • Since most sequences being aligned are not between such closely related species, the PAM1 matrix is multiplied by itself many times to mimic lots of small changes. • This concept is a serious weakness: multiplying of errors magnifies them. • The number after “PAM” is the number of times the matrix has been multiplied by itself. • Common ones: PAM30, PAM70, PAM120, PAM250. Bigger number = better for more distant relationships
BLOSUM • =BLOck Substitution Matrix. Derived in the 1990’s by Henikoff and Henikoff. • Based on local alignments of Blocks, which are short, highly homologous regions, with no gaps • Sequences were grouped together if they were very similar, and then comparisons were made between the groups as in the PAM matrices. • No attempt at phylogenetic trees • The different BLOSUM matrices have specific cutoffs for amino acid identities. For example, the BLOSUM62 matrix is based on sequence blocks with at least 62% identity. • The odds ratio for each substitution is calculated, but instead of taking the base 10 log and multiplying the result by 10 as in PAM, BLOSUM takes the base 2 log and multiplies by 2. This gives scores in “half-bits”. • Bigger numbers imply closer evolutionary distance, so BLOSUM80 is better for closely related species than BLOSUM 45. • BLOSUM seems to work better than PAM • BLOSUM62 is the default used in BLAST searches.
BLOSUM62 and PAM120 Matrices The colors represent different physiochemical properties. Note that some substitutions are positive, which indicates that they occur more frequently than chance. The average value is negative: it is more likely than an amino acid will stay the same than change. The diagonal values are unchanged amino acids, all of which have positive values. Some are less changeable than others: tryptophan and cysteine especially.
Gaps • Gaps occur with roughly 1/10 the frequency of base substitutions, so they are common in most alignments. • Symbolized by hyphens ( --- ) paired with residues: like a mismatch with a blank space. • You can assign a penalty for each gap position. • This is called a linear gap penalty: the total penalty is proportional to the gap length. • The problem is, once you start putting them in, you can get almost anything aligned. • Alignment programs usually distinguish between creating a gap and extending a gap. Thus, the gap opening penalty and a (smaller) gap extension penalty. • This is called an affine gap penalty. • Although substitutions have a lot of theory behind them, gap penalties are generally determined by heuristic means. • Heuristic = a method or value determined by trial-and-error experiments, without a strong guiding theory. • In this case, gap opening and extension penalties are the result of trying many possibilities and seeing which ones give the most pleasing alignments. • The BLAST default is a -11 penalty for opening the gap and -1 for each additional base of gap. (11/1) • Other options on BLAST at NCBI are 7/2, 8/2, 9/2, 10/1, and 12/1
Comparing 2 distantly related sequences with different gap penalties: • Top sequence has fewer gaps and longer matches. • Bottom sequence has more identities and similarities overall, but lots of little gaps. The matches near the C-terminal are absurd. • Look at the short segment after the first gap in the lower sequence: gained 3 identities
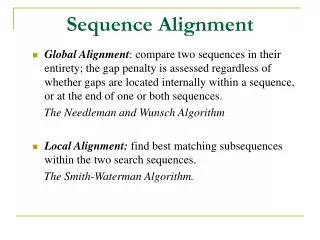
How Do We Make Alignments? • We have been working on scoring an alignment: identities and similarities, and gap penalties. • But, how do you get an alignment to score in the first place? • Trying all possibilities is one of those “more possibilities than there are atoms in the Universe” problems. • The general solution: “dynamic programming”, a technique first applied to DNA sequences by Needleman and Wunsch (1970) • Their original method gave global alignments. • Smith and Waterman (1981) provided a slight (but critical) modification that produced local alignments, which work better than global for most genes. • These methods provide an optimal alignment, for a given substitution matrix and set of gap penalties. • They are much faster than trying all possibilities, but still not quick enough. Various refinements and heuristic methods improve the speed.
Smith-Waterman Algorithm • Start with a 2-dimensional matrix with one sequence along the top and the other sequence down the left side. All possible pairs of nucleotides or amino acids are represented by the cells of the matrix. • “Edge rows” along the top and left side. • All possible alignments are represented by the paths through the matrix. • a diagonal step is an alignment between the query and the subject sequences at that position • a vertical step is a gap in the query sequence • a horizontal step is a gap in the subject sequence. • Have a match reward and penalties for mismatches, gap openings, and gap extensions. For our example, we will use the BLOSUM62 matrix, with a linear gap penalty of -6 • Initialize the edge rows to scores of 0.
BLOSUM62 With positive scores marked
Calculating Cell Scores • Using BLOSUM62 for substitutions, and a -6 linear gap penalty. • The cell at row i and column j has a score S(i, j) • Starting at top left cell, proceed row-by-row, calculating each cell’s score S(i, j). S(i, j) is the maximum of: • 0 (i.e. set to 0 if the calculated score is less than 0) • S(i-1, j-1) + match/mismatch score for cell (i, j) • S(i, j-1) + match/mismatch score for cell (i, j) + gap penalty • S(i-1, j) + match/mismatch score for cell (i, j) + gap penalty For the cell in question, the amino acids don’t match. On the BLOSUM62 matrix, this is a -1. There are 3 possible alignment paths to this cell: 1. diagonal (query/subject alignment). Score = 9 – 1 = 8. 2. vertical (query gap). Score = 8 – 6 – 1 = 1 3. horizontal (subject gap). Score = 2 – 6 – 1 = -5 (set to 0) Since 8 is the maximum, the cell’s value is set to 8.
Smith-Waterman Details • Start at the first row: T doesn’t match anything, and looking at BLOSUM62, the only positive score for a mismatch is +1 with S. • We keep track of the 0 -> 1 diagonal • Second row: H matches N = +1, but nothing else.. • The diagonal staring with the 1 in the previous row is a H-A mismatch = -2, so 1 -22 = -1, which is scored as 0. • Third row: I gives positive scores with M. L, and V. But, nothing builds on the previous row.
More S-W • Fourth row: S has positive scores with N, A, and T. • S-S = +4 match, added to 4 from the diagonal = 8 • S-A = 1. For a horizontal move (subject gap), 8 + 1 – 6 = 3. • S-I is -2 mismatch, added to 2 from the diagonal = 0. • S-G = 0 mismatch, added to 4 from the diagonal
Traceback • Then, start at the highest score in the matrix and trace back the path leading through the highest previous scores to 0. Go left and up only, preferring the diagonal path if a choice needs to be made. • High score is 16, in the bottom row (but it could have been elsewhere). • If the high score isn’t at an edge, you also need to trace it forward until is reaches 0. • Write the alignment starting at the top. • It doesn’t cover the entire sequence: it is a local alignment, not global. • It isn’t perfect: the strong diagonal from LI and the 0 mismatch score from a G-N match overcame the gap penalty needed to put a gap where the G is. • Nevertheless, given the BLOSUM62 matrix and the -6 linear gap penalty, this is an optimal alignment, ISALIGNE IS-LIN-E
Changing the Gap Penalty • The top one has a -4 gap penalty and the bottom one has a -8 gap penalty (both linear). They give somewhat different alignments.
A Needleman-Wunsch Alignment • Needleman-Wunsch is a global alignment algorithm. The alignment path starts • at the lower right and goes to the upper left. • The matrix is initialized with the gap penalties (-8 here) • Scoring is the same as for Smith-Waterman, except that scores can go below 0. • As in S-W, the path to each cell is recorded, and the best path is traced back to • get the alignment.
Speeding Things Up • A lot of time is wasted calculating the whole matrix—a lot of it is very far away from the main aligned region. • So, only calculate diagonals where the score is above some minimum. • Note that by not calculating the entire matrix, you risk missing an optimal alignment • Need to start with a well-aligned region on the main diagonal—we will see how to do this soon. • The FASTA alignment method uses the “band drop” method, which is based on the assumption that gaps can only be smaller than some maximum (default = 15). • Thus, only the main diagonal and 15 diagonals on with side of it need to be calculated • If a gap appears, you can re-adjust which diagonals you calculate to keep the best alignment centered.
X-Drop Method • BLAST uses the X-drop method, which calculates the scores along anti-diagonals (moving from top-right to bottom-left) • If the row number is i and the column number is j, the anti-diagonal you are working on in always d = i + j. • Only record scores for cells which are greater than some set amount below the current maximum score. • Set other cells to negative infinity • Result is that you are only calculating cells between an upper limit iU and a lower limit iL. • Limits are re-calculated for each anti-diagonal as you proceed. • Illustration shows limits contracting • If the cells at the current iU and iL are not negative infinity, expand iU and iL.
Short Exact Matches • Smith-Waterman is exact but slow. • The best improvement on S-W involves the a list of short sequences that match exactly between the query and the subject. • Start by making a list of the position of all possible “k-mers” or “k-tuples” or “words” in both sequences. • K = length, set at 2 for protein and 6 for DNA in the FASTA program, and 3 for protein, 11 for DNA in BLAST. • Find all matching k-mers between query and subject, and combine them to form regions of exact ungapped matches • Fun computer science algorithms for indexing positions of k-mers: suffix trees and hashing/chaining. Discussed in book.
FASTA Method • This method starts out by trying to find the diagonals with the best matches on them, using the list of k-tuples. • Once the best ungapped perfect matching alignments are found, the alignments on each diagonal are connected. The score for each diagonal is decreased by a set amount for each position that is not part of a perfect match. • Then take a band around the diagonal with the highest score, and use the Smith-Waterman dynamic programming method to produce an optimum alignment. • At this point, mismatches and gaps in one sequence but not the other are allowed. This is done using a substitution matrix and an affine gap penalty
BLAST • BLAST started out as a way to develop a solid statistical theory to determine the significance of alignments. • We will discuss the theory briefly later. • The theory only works for ungapped alignments • Two basic version: the old version was for ungapped only, and the new version incorporates gaps • Turned into a very good general alignment method. • Starts out by finding all k-mers in the query sequence (with k=3 for proteins and 11 for DNA by default) • Match to k-mers in subject database using BLOSUM62 matrix, so perfect matches are not necessary. Collect all matches with a score greater than a threshold. • Another interesting bit of computer science here: matches are found using a deterministic finite-state automaton. • After k-mer matches are found, there is a difference between old version vs. new: • the old version extends each k-mer match, without gaps, as much as possible, until the total score falls to some set amount below the maximum. These ungapped aligned regions are called “high-scoring segment pairs” or HSPs. The best scoring HSP can be used for significance tests.
More BLAST Theory • The new version of BLAST uses a two-hit method: if 2 k-mer matches are found on the same diagonal (as in the S-W matrix) and within 40 residues of each other, they are extended to form HSPs. • The threshold for accepting a k-mer match is lower for the new method (score of 11) as compared to the old method (score of 13). • The two-hit method requires fewer extensions than the one-hit (old) method. • HSPs above a threshold are used as a seed for S-W alignment in both directions, using the X-drop method to limit the search area. This produces a gapped alignment. + = hit with T=13 (old), and ● = additional hits with T=11 (new). Lines show extensions of 2-hit diagonals
Filtering Out Low-Complexity Regions • Simple sequence repeats in DNA, and regions of repeated amino acid sequence cause problems because they align with many different database sequences in a meaningless way. • Generally filtered out in large database searches: the low-complexity regions are replaced by X’s (protein) or N’s (DNA) • Calculations of sequence complexity: how much information a given short sequence holds. • Databases of common repeated sequences, especially for well-known genomes like human and Arabidopsis.
Statistical Significance • Imagine an attempt to align 2 sequences, resulting in some score (bit score in BLAST output). • Now, randomly permute one of the sequences and attempt to align them. • Repeat this many times with different permutations. • Result is a distribution of the optimum score for each attempt: an extreme value distribution. • Note the heavy right-hand tail: high scores are more common than would be expected with a normal distribution. • Lots of statistical theory goes into deriving a formula for calculating a relationship between alignment score and probability • Probability of score x • in random permutations b. Probability of observing a score of at least x
More Statistics • P-value: the probability that two sequences will have an alignment score (S) better than some value x is a function of: • Query sequence length (m) • Subject sequence (database) length (n) • λ and K, which are parameters that depend on the substitution matrix and sequence composition. • P(S >= x) = 1- exp(-Kmne-λx). (Don’t memorize this!) • It’s only approximate for gapped alignments, but widely used. • P-value is the probability that the query sequence would give an alignment scoring S or better with a randomly chosen sequence (i.e. one that is not related to the query). • P-value is a number between 0 and 1. • E-value, which is what BLAST and FASTA report, is P-value multiplied by the number of sequences in the database. • E-value is the number of sequences (of the same length as your query sequence) in a completely random database of the same size as your database that would be expected to give a score of S or better with your query sequence • So, an e-value of 1 means that you would expect at least 1 random sequence to match your query: it is not significant since you want the match to be so unusual that it would be extremely unlikely to occur by chance. • In general, I don’t trust e-values worse than 1e-10 (= 1 x 10¹⁰). • Most computers can’t calculate less than 1e-180 and give 0.0 for matches better than this.
A Return to the Practical Side! • A number of different BLAST programs are available. The main ones differ primarily by the type of query and subject sequences used: • blastn: query is DNA, subject is DNA • blastp: query is protein, subject is protein • blastx: query is nucleic acid that is translated by the program into protein sequences (all 6 reading frames); subject database is protein. Useful for imperfect query sequences such as ESTs • tblastn: query is protein; database is DNA translated into protein sequences in all 6 reading frames. Useful for low quality databases. • tblastx: query is DNA translated into protein, subject is nucleotide translated into protein. Both are translated into all 6 frames. It is very slow relative to the other BLAST types. • For general use, the BLAST system at NCBI is probably the best and easiest to use. • The “nr” database is a non-redundant database of all known sequences. It is very large, but does the best job at answering the question of what known sequence is the best match for your query. • There is a variant BLAST called WU-BLAST, because it was coded at Washington University. It is basically equivalent to NCBI BLAST • Many databases have internal BLAST search engines that just search their own database.
A Sequence to BLAST • This is a randomly chosen gene from Bacillus megaterium. ORF00135. • >ORF00135 | chromosome 538197 - 538721 rev_comp = 1 • MKAKLIQYVYDAECRLFKSVNQHFDRKHLNRFLRLLTHAGGATFTIVIACLLLFLYPSSV • AYACAFSLAVSHIPVAIAKKLYPRKRPYIQLKHTKVLENPLKDHSFPSGHTTAIFSLVTP • LMIVYPAFAAVLLPLAVMVGISRIYLGLHYPTDVMVGLILGIFSGAVALNIFLT* • Now go to NCBI--> BLAST --> Protein blast. • Paste the sequence and header into the box. • Note the database: default is nr. You could use ESTs, or go for a specific organism • Algorithm: blastp is the standard one used for protein sequences • Note the BLAST 2 sequences box--we’ll try this later • Note the box for showing the results in a new window. • Algorithm parameters: just under the BLAST button on the bottom of the page • maximum number of sequences to display (default = 100) • Expect threshold: maximum e-value to display (default = 10) • Scoring matrix and gap penalties • low complexity filters • When in doubt, accept the defaults.
BLAST Results • It takes a while: the screen updates every few seconds. • The Conserved Domains Database (CDD) is automatically searched, and it is much faster--you get a graphical image of domain structure. • PAP2-like superfamily, which can be clicked on for more info • Graphic Summary: a representation of the the top 100 hits (by default). • Length of the bars shows extent of homologous region, and color shows alignment scores (bit scores). • Mouseover the bars to get a bit of info about each hit, all of which is duplicated below. • Descriptions: a list of the sequences hitting your query, with the best score on top. • Has a link to that gene, gene name and (often) species, bit score, e-value • Alignments: detailed alignments for each hit • Get percentage of identities and positives (i.e. positive match scores in BLOSUM62), number of gap bases, sequence length • “Expect” = e-value. • Aligned query and subject sequences, with identities and positives shown between them, and position numbers in the sequences. • Looks like the top hit is annotated incorrectly: everything else including the CDD domain information says this is a phsophatase, but this hit says it is ribosomal protein S2 from Bacillus licheniformis.
BLAST Two Sequences • Get the B. licheniformis ribosomal S2 protein sequence (the top hit) • the sequence is given under ORIGIN at the bottom. It will work with the BLAST search despite having spaces and numbers in it. 1 mnklmvgiyn fecriflgmn rlfhqktlnr yfrssthlgg amctisacls lllfgsgsvr 61 tagmasalal lvshlqvmli kklyprkrpy ltlketqvlq nplkdhsfps ghttavfsvi 121 tplmiffpil alllipvgvs vglsriylgl hypsdvlagt algisvgtls amif • Or, you can just paste in the reference number: ref|YP_080329.1 • Check the Blast 2 Sequences box: now there are 2 boxes to paste sequences into. • Results: same as with regular BLAST, but also a Dot matrix view: click it. • Full length alignment, with 2 small gaps
Local BLAST • Many systems have less fancy interface, both for input and output. • Try using the Bmeg BLAST at NIU with the B. licheniformis sequence. The database is just genes from B. megaterium, so it is a very fast search. • You get the Description lines and the Alignments, but none of the graphics or links. • Note the masked region (XXXX) • Also a little summary of technical stuff at the bottom: λ and K, counts of HSPs, etc.