Download
1 / 23
230 likes | 235 Vues
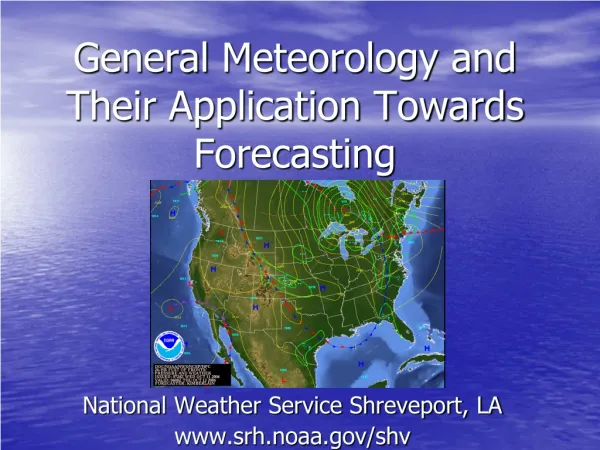
Radar Refractivity: validation and application to forecasting. Crystalyne R. Pettet, Tammy M. Weckwerth, and James W. Wilson—NCAR/ATD Frédéric Fabry and ShinJu Park—McGill University. Validation. Sfc comparisons. S-Pol N varies most strongly with moisture. Sfc comparisons.

E N D
Radar Refractivity: validation and application to forecasting Crystalyne R. Pettet, Tammy M. Weckwerth, and James W. Wilson—NCAR/ATD Frédéric Fabry and ShinJu Park—McGill University
Sfc comparisons S-Pol N varies most strongly with moisture
Sfc comparisons High correlation between S-Pol N and station N
Mobile mesonets S-Pol N compares favorably with areas of relatively constant mobile N
Mobile mesonets S-Pol N gradients are smoothed
UWKA S-Pol N gradient smoothed over ~10 km S-Pol N compares favorably with areas of relatively constant UWKA N
AERI • Transition between 220-355 m from high to low r values
P-3 • If CBL is well-mixed, N represents at least half the depth of the CBL.
AERI—diurnal and height differences • N bias is strongest at night and improves with mixing of CBL • Strongest relationship occurs at low levels
AERI—diurnal and height differences • Low levels—strong relationship from one hour after sunrise until 2 hours after sunset • Increasing height—strong relationship begins later in the morning and drops off by 2200 UTC
Soundings • Similar results to AERI—lowest 200-250 m
SRL • Strong correspondence between SRL mixing ratio magnitude, surface station mixing ratio, and S-Pol N
Summary • Radar refractivity shows excellent correlation with refractivity calculated from other datasets • Vertical depth represented by radar refractivity is typically below 200-250 m AGL, but may be dependent upon the extent of vertical mixing • Horizontal scale of refractivity varies, and appears to be as high as 2 km at times and lower than 4 km at other times
Summary • Radar refractivity shows great promise as a potential nowcasting and forecasting tool
For more information… • Contact me at pettet@ucar.edu to get a pdf of the manuscript that has been submitted to JAM that this talk is based on.