Download
1 / 45
450 likes | 455 Vues
Business Cycle, GDP, Unemployment, and Inflation. . “Unemployed” “Inflation”. The Business Cycle. U.S. has experienced a 3.0% average economic growth over last 60 years! But, the 3% average has many fluctuations due to The Business Cycle :

E N D
Business Cycle, GDP, Unemployment, and Inflation . “Unemployed” “Inflation”
The Business Cycle • U.S. has experienced a 3.0% average economic growth over last 60 years! • But, the 3% average has many fluctuations due to The Business Cycle: • Selected Years (rounded to nearest whole %): • 1984: 7% Growth in Goods & Services • 1991: -1% • 1997: 4% • 2001: 0% • 2017: 2.3%
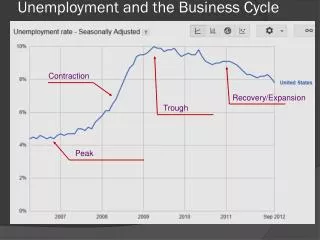
The 4 Phases Of The Business Cycle 4 Phases Of The Business Cycle • Peak • Recession • Trough • Recovery (also called expansion)
The Business Cycle (Blue Line is 3% Avg. Growth) Peak Peak Trend Peak Expansion Growth Economic Growth Recession Expansion Trough Recession Trough Time 9-4
4 Phases of the Business Cycle • Peak • Economy is doing at its best • Full employment (4% or lower unemployment) • Maximum output, Household Income is high • Prices likely to rise (inflation) • Demand tends to drive up prices since production is at or near capacity (no more resources to produce and meet the rising demand…thus, producers raise prices)
4 Phases of the Business Cycle • Recession • Economy begin to recede or slump due to a decrease in spending. • Declines in • Employment (i.e., more unemployment) • Output or production falls, Incomes fall • Prices often stable (slow to fall) • U.S. averages 1 recession every 6 years > Last recession was the Great Recession of 2007
The Business Cycle Source: National Bureau of Economic Research, www.nber.org, and Minneapolis Federal Reserve Bank, www.minneapolisfed.gov. Output data are in 2000 dollars LO1
4 Phases of the Business Cycle • Trough (the low point) • Employment, Output/production, and income are all at their lowest point • “Bottoming out” of a recession • “V” shaped (quick bottom and then expand) or “U”shaped (long bottom and then expand) • 2001 recession was a “V” (short: 8 mos.) • 2007 recession was a “U” (long: 18 mos.)
4 Phases of the Business Cycle • Recovery or Expansion Phase • Movement out of trough towards Peak phase • Employment, output/production, and income all rise • Prices usually start to rise again as nation gets closer to full employment as businesses raise prices due to increasing demand
Causes of the Business Cycle • Causes of The Business Cycle • Changes in total spending: Number 1 Reason • “Bubbles” & “Popped Bubbles” • Discuss stock market value rises and crashes • Discuss housing market value rises and crashes • Major inventions increase business activity • Railroad • Automobile • Computer • Internet
Key Economic Goals • Top 3 Economic Goals & Measurements • Economic growth (more goods & services, or Gross Domestic Product (GDP)) • Full employment (all available resources employed, or low unemployment) • Price level stability (little or no price swings, meaning little inflation (rising prices) and no deflation (prices fall).
Economics Quiz • What are considered the three major economic goals? • Falling output and income would be a characteristic of the ______ business cycle phase. • Prices usually ______ in the peak phase, ______ in the recessionary phase, and _________ in the expansionary phase. • What is the number 1 cause of a recession? What would happen if stock prices decreased by 30%? • What industries are affected most and least by a recession? Why? (This answer is not in notes)
Opening Comments- GDP • Gross Domestic Product (GDP) is perhaps the most well-known macroeconomic measurement! • A measurement that tracks the market value of goods & services produced (measures “economic growth”) • GDP is reported quarterly by the government (Commerce Dept.) • U.S. GDP is approx. $20,000,000,000,000 per year • U.S. has the largest GDP (next 4: China, Japan, Germany, and UK) • U.S. GDP has averaged a 3.0% annual GDP growth rate since 1950 • GDP per capita (per head) is a superior measurement of “standard of living”. GDP per capita is $62K in U.S. versus only $10K per head in China.
GDP Defined • GDP Defined: • “The total market value of all final goods and services produced within a country in one year” • GDP is a monetary measurement • A measurement expressed in money • Approx. $20 trillion per year in the U.S.
GDP: A Closer Look At The Definition • GDP is the total market value of all final goods & services produced within a country in one year • “Produced”…..not “Sold” • “Produced within a country” (whether U.S. or foreign company as long as in-country!) • U.S. GDP includes Toyotas made in Texas • U.S. GDP excludes Cadillacs made in Canada
GDP: A Closer Look At The Definition • GDP is the total market value of all final goods & services produced within a country in one year • “Final”: purchased for final use by purchaser • Goods that are not final are “intermediate goods”. • Intermediate goods are purchased to be included in another product or to be resold • Tires for a new car, Computer chips for a PC • All business to business transactions are excluded since they are intermediate transactions. • Using only final goods avoids “doublecounting” which would inflate GDP
GDP Includes Services As Well As Goods • Services is the primary component of GDP (80%) • All final services: • Haircuts, tax work, consulting, rent, telephone, agent sales (stocks, housing), restaurant sales, etc • Excludes “intermediate” services • Advertising work done for company • Maintenance work done for company • Cleaning the toilets or dragging the infield at a Nationals game
GDP: What Else Is Excluded From GDP Besides Intermediate Goods: ALL Non-Production Transactions • Excludes Financial Transactions (non-production) • Stock purchases • Homes that are resold (home is counted once when originally built) • Govt. transfer payments such as social security, unemployment pay, and welfare. • Excludes “secondhand” sales or used items sold • Excluded to avoid double counting • Resell a 1968 Ford Mustang (not in GDP)
Economics Quiz • Honda produces automobiles in Ohio. Should Honda’s annual production value be included in GDP? • Businesses often use advertising agencies to develop their promotions. How are advertising sales reflected in GDP? • A car manufactured in 2011 was sold new to a customer in 2012. In 2018, the customer sold the car to a friend. What is the effect on 2011, 2012, and 2018 GDP?
Economics Quiz • As the stock market or home prices fall, how is this accounted for in GDP? Why? • What is an “intermediate transaction”? Explain why intermediate transactions are excluded from GDP. • If Smith purchases supplies for his family business, what is the impact on GDP? What if he purchases supplies for his Intro to Business & Marketing class?
Nominal Versus Real GDP • “Nominal” GDP • GDP Unadjusted. Reported “as is” in current dollars. • “Real” GDP • GDP Restated for inflation (or deflation) • Key Points: • Nominal GDPs can be misleading due to price level changes • An increase in GDP could actually mean less output if prices rising faster than output • Real GDP makes GDPs comparable between years
GDP and Economic Well-Being • GDP not intended to be a measure of society’s overall well-being • Shortfalls: • Excludes certain non-market home transactions • Homemaker production (cleaning, carpentry,baby sitting) • Swap transactions (service for service swap) • Excludes underground economy (estimated 8% Of GDP) • Excludes value of increased “leisure time” • Excludes product quality improvements • Says nothing of the “right goods” or the equitable distribution of those goods • Does not account for impact to the environment • Says nothing of GDP per capita (superior measurement)
Unemployment • Unemployment Rate Calculation • Unemployed / Labor Force x 100 • Labor Force = Employed + Unemployed • Calculation of Unemployment Rate • Reported by Bureau of Labor Statistics (Govt.) • Calculated Monthly based on survey of 60,000 households each month (statistical sample) • To be “unemployed” must be actively seeking work
Unemployment Calculation: Approximate Figures • 325M Total U.S. Population • (67)M Under 16 and Institutionalized • (96)M Not in Labor Force (retirees/homemakers /students) • 162M Labor Force (employed + unemployed) • 156 M Employed (full time/part time) • 6 M Unemployed (looking) • 3.7%: Unemployment Rate (6 M / 162 M)
Calculating Unemployment: An Example • Hypothetical Facts: • 1000 Population total • 400 Not in Labor Force (retirees, homemakers, students) • 100 Under 16 and in Institutions • Unemployed 50 • What is the unemployment rate?: ________% • What is the size of the Labor Force?: _________
Unemployment • Criticisms of unemployment rate: • “U.S. unemployment rate is understated” • Part-time workers are counted as employed • They may really want full time jobs! • “Discouraged workers” are not counted as unemployed • Discouraged worker: “one who wants a job but has stopped looking” • Treated as “not in labor force” (treated like a “stay-at-home parent”, even though they want a job)
Unemployment • The Three Types of Unemployment • Frictional • Structural • Cyclical
3 Types Of Unemployment • Frictional Unemployment • “Temporary and Unavoidable Unemployment” • New college grads looking for jobs • Parents returning to the work force • Quit job to look for a better one • Relocating to a new area • Fired from your job and looking for new one • Considered a necessary unemployment and non issue • Averages about 2% of the 4% Unemployment rate
3 Types Of Unemployment • Structural Unemployment • Due to changes in the structure or composition of the labor force (a fundamental change) • Examples of Structural Unemployment: • Technology (machines) displaces workers • Industry Mergers & Acquisitions • International Trade (workers lose jobs due to trade) • Changing Demand (Tobacco, Coal Mining) • Averages about 2% of the 4% Unemployment rate
Unemployment • Cyclical Unemployment • Occurs during recessionary phase • Highest at the trough phase • Not unique to a particular industry • Of the 3 unemployment types, this is “bad” unemployment and the unemployment we are trying to avoid. • Right now, this is 0% as our economy is at full employment!
Full Employment or The Natural Rate of Unemployment • The Full Employment Unemployment Rate or The Natural Rate of Unemployment (NRU) • Does not mean zero unemployment! • Full employment = frictional + structural unemployment • Full employment excludes all cyclical unemployment • Economists estimate the NRU to be about 4%! • If actual unemployment rate > natural rate, then there is cyclical unemployment! • Example: If actual unemployment rate is 5.5% and the natural rate is 4%, then cyclical unemployment is 1.5%.
Unemployment Rates by Country (October 2018) U.S.: 3.7% Euro Union: 6.8% UK: 4.0% Canada: 5.9% Mexico: 3.5% China: 3.8% Russia: 4.6% South Africa: 27.2% Brazil: 12.1%
LO2 LO3
Economics Quiz • How is unemployment calculated? In your own words, describe what the “labor force” is. • Why do many say our unemployment rate is understated? • How are part-time workers and discouraged workers counted in the unemployment calculation? • What are the three types of unemployment? Describe an example of each. • _________ unemployment occurs during the _________ business cycle phase and is caused by a deficiency of ____________.
Economics Quiz • When workers are replaced by machines, _______ unemployment results. • What kind of unemployment is being created by thousands of manufacturing workers losing their jobs? • What is full employment and the natural rate of unemployment? • If the USA’s natural rate of unemployment is 5.0%% and the actual rate rises to 9.0%, what type of unemployment is the 4.5% difference ? • Can the NRU be less than the actual rate? How?
Inflation LO3 LO2
Inflation: Consumer Price Index (CPI) • Inflation Defined: “A rising general level of prices” • Measured by the Consumer Price Index (CPI) • A “basket” of over 300 tracked goods & services • The % change in the prices of the basket represent the inflation rate. • Weighted index based on consumer spending patterns • Housing inflation has the highest weight since Households spend the most on housing. • Inflation has averaged 3% historically but only 2.2% over the last 3 years! Low inflation is good!
Inflation: What Causes It? • Types of Inflation • Demand-Pull Inflation • Total spending in excess of production capacity • Often described: “too many dollars chasing too few goods” • Demand curve shifting to the right
Inflation • Types of Inflation (continued) • Cost-Push Inflation (aka: Supply-Side Inflation) • Cost-push Inflation summarized: • Prices rise due to rising production costs (factors of production) called “supply shocks” (oil, wages, other materials) • Supply curve “shifts to the left”
Inflation: Nominal vs. Real Income • Nominal vs. Real Income • Nominal Income: actual US dollars received as wages or salaries • Real Income: measures the amount of goods and services that nominal income can buy • Nominal vs. Real Income Principles • If nominal income increases at a faster percentage rate than inflation, real income rises (increased “purchasing power”) • If nominal income increases slower than inflation, real income falls (decreased “purchasing power”)
Inflation: Nominal vs. Real Income • Nominal vs. Real Income: • Equation: • % change in nominal income – % change in inflation = % change in real income • An Example: • If wages increase 4%, but • Inflation increases 7% • Real income has decreased 3%, or said another way: • Purchasing power has decreased 3%
Who Does Inflation Help and Hurt? • Inflation Hurts: • Savers with low fixed interest rates • Lenders (Creditors): they are paid back with dollars that buy less • Fixed income receivers • Those on pensions (fixed amount retirement pay) • Note: social security indexed to inflation • Landlords with long term lease contracts • Inflation Benefits: • Borrowers (Debtors): pay back loans with less valuable dollars
Categories or Types of Inflation • Creeping Inflation: < 10% per year • Galloping Inflation: 10-100% per year • Hyperinflation: > 100% per year • Feeds on itself: people spend immediately but producers want to sell tomorrow • Causes economic breakdown: people give up on money system and revert to barter • Germany in the 1920s • Hungary in 1946 • Zimbabwe in 2008
Economics Quiz • What is inflation and how is it measured? • What are the two main causes of inflation? • How do the two inflation types link to the supply and demand curves? • What is the relationship between spending and inflation? • Differentiate between nominal income and real income. What happens to your real income if you get a 10% raise and inflation is increasing by 13%? Are you getting richer or poorer? • Who does inflation benefit? Who does it hurt?