Download
1 / 14
150 likes | 284 Vues
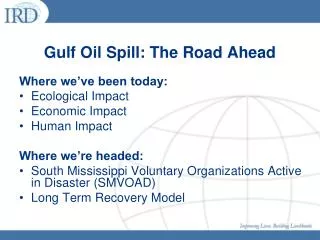
Modeling the Oil Spill in the Gulf. Donna Reinhart, Barbara Simon-Waters and Beth Marass. What do we know about the properties of oil in the Ocean and how it interacts with the environment?. Great sites for information. Gulf Stream Currents: animation:

E N D
Modeling the Oil Spill in the Gulf • Donna Reinhart, Barbara Simon-Waters • and Beth Marass
What do we know about the properties of oil in the Ocean and how it interacts with the environment?
Great sites for information • Gulf Stream Currents: animation: • http://oceancurrents.rsmas.miami.edu/caribbean/caribbean-videos.html • Bathymetry Map of Gulf of Mexico: • http://oceancurrents.rsmas.miami.edu/caribbean/img_topo1/loop-current2.jpg • Model of the dispersant acting on an oil spill: • http://www.amsa.gov.au/Marine_Environment_Protection/National_Plan/General_ILooking • The seasonal changes in the Loop Current: • http://oceancurrents.rsmas.miami.edu/atlantic/loop-current_3.html
Outline of Activities • Give students background data on the history of the spill • Model the way oil acts in fresh and salt water • Model the way dispersants work in fresh and salt water • Model the action of wind on surface water • Have students graph surface wind data from Gulf of Mexico Buoy data http://www.ndbc.noaa.gov/maps/WestGulf.shtml • Students will then go to the NY Times site http://www.nytimes.com/interactive/2010/05/01/us/20100501-oil-spill-tracker.html • They will find 3 days that the plume moved the most, return to the buoy site and graph those days. Comparing the data with the plume they will answer questions about their findings.
Teacher Notes • 1. Assemble the following materials. Ideally you will have one of each of the following per lab table for 3 to 4 students. Have goggles for each student. • Large clear plastic container 12 x 24 x 10 inches (deep) • 50cc syringe with fine gauge tube attached • Straws or small fans • Spray bottle • Modeling Clay • Cooking oil • Dawn dish detergent • Small light • Have students secure the clay firmly to the bottom of the container before adding the tubing. • Have plenty of paper towels (or cloth towels) for clean-up. • Teacher Notes for Gulf of Mexico Buoy Activity • You will need one computer for each pair of students and an activity sheet for each student.
Trying to set up an experiment Special Thanks to Tratnyek Lab and Jim Nurmi, Phd and Paul Lim
Modeling the Oil Spill: Student Hand-out • Objectives • Students will observe the movement of oil under pressure in a tank of water • Students will compare the density of water with the density of water. • Students will observe the movement of oil on the water’s surface in response to winds. • Students will model the action of a dispersant on surface oil. • Materials • Large clear plastic container 12 x 24 x 10 inches (deep) • 50cc syringe with fine gauge tube attached • Straws or small fans • Spray bottle • Modeling Clay • Cooking oil • Dawn dish detergent
Procedure • Part 1: The Oil Spill • Stick a egg size piece clay to the bottom of the container. • Imbed the fine gauge plastic tube in the clay so that two ends are visible, allowing about 2 inches of one end and only .5 inches of the other to show. • 3. Set up a light so that the entire apparatus is back-lit. • When your model is secure, fill with water to within 1 inch of the top of the container. • Fill the syringe half way with oil. • Attach the end of the syringe to the 2 inch tubing under the water. • Force the plunger into the syringe so that the oil spurts out of the other end within the clay. • Allow about 10 cc to be removed from the syringe before withdrawing. • Part 2: The Wind • Set up a small fan so the breeze it creates blows across your model. • Set up a second small fan blowing in a different direction but keep the first one on. • Part 3: The Surfactant • Let the container of oil and water come to rest after removing the fans. • Fill a spray bottle with Dawn dish detergent. • Lightly spray the surface of the oil coating the water.
STUDENT QUESTION SHEET • On a separate piece of paper, type your answers to the following questions demonstrating your understanding of this experiment. • You have attempted to create a model of the BP oil spill. Why did your oil come up to the top of your container with such force? • Was this a reasonable model of the oil’s entry into the ocean? Explain. • Why did the oil rise to the top of the surface? What property of oil explains this? • When you turned the fan on what describe what happened at the water’s surface. • Describe how the water changed when you turned on the second fan. • How did the dish detergent interact with the oil at the water’s surface?
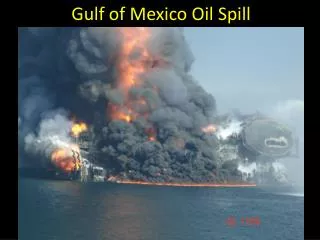
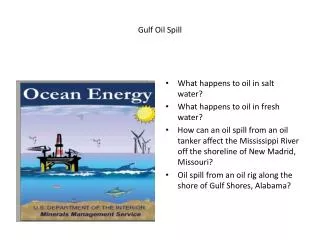
Gulf of Mexico Buoy⎯Student Handout • In 2010, the BP Oil Rig Deepwater Horizon exploded releasing millions of gallons of oil into the Gulf of Mexico. Many physical ocean characteristics can effect the flow of the oil. In this activity you will look at the surface winds of 2 buoys in the Gulf of Mexico and graph the data. • Your Task⎯ • Go to http://www.ndbc.noaa.gov/maps/WestGulf.shtml • Click on Station 42001 • Click on Real Time Data in tabular form • Click on Real time continuous use data • Mac’s click apple F and find 00 00, for PC’s click control F and put 00 00 find • Write down all the wind readings • Return to http://www.ndbc.noaa.gov/maps/WestGulf.shtml and scroll over to Western Florida and click on Station 42036 • Repeat number 3-6 • Create a bar graph with the data
Oil Spill Plume⎯Student Handout #2 • We have already looked at Buoy data from the Gulf of Mexico and graphed the wind speed over the last month. What does this mean? Can we predict the movement of an Oil spill with wind currents? This Activity will help you answer these questions. • 1. Go to http://www.nytimes.com/interactive/2010/05/01/us/20100501-oil-spill-tracker.html • Move the date until you find a date where there was a large movement in the oil spill over 3 days. • Return to the NOAA buoy site and look at the wind data from that time and graph the data, the same as you graphed the earlier month data, this time the data will be 3 days. • Look at your earlier graph and find what day(s) that you graphed that had the highest wind. • Return to the New York Times interactive site and check those dates to see if there was a large movement of the oil plume.
Student Assessment • http://www.eoearth.org/article/Deepwater_Horizon_oil_spill • What happened to the oil when you dropped it on to your ocean? Did it sink? Float? Mix in? Why? • What happened when the detergent (the dispersant) was added to your oil-slicked ocean? • Where would the oil go in the "real" ocean after a dispersant (like the dishwashing detergent) is used? • How clean is your ocean now that it has dishwashing detergent in it? • How would dispersants affect water quality? • In what way(s) can dispersants impact the environment? • What are the major difficulties in cleaning up an oil spill?
Extensions • After doing the activities of this lesson, students, working in groups of 2 • or 3, can attempt to "clean" up the oil spill. Students will use a 9"x12" • or larger container * with sand at one end of the container to simulate • their beach. Water will be added to the container but should not flood the • beach completely. An oil spill can be created and the detergent added as a • dispersant. Student groups can select different ways to clean the oil from • their beach/water. Skimmers, warm-water washing, booms, peat moss, cotton, • etc can be used. *A cardboard box lined completely with plastic (cut from a • thick garbage bag) can be used for this extension. • http://www.ifitwasmyhome.com/ Students can "place" the expanse of the oil spill over their state and infer how the spill would impact the environment (both abiotic and biotic) in their state.