Download
1 / 28
280 likes | 348 Vues
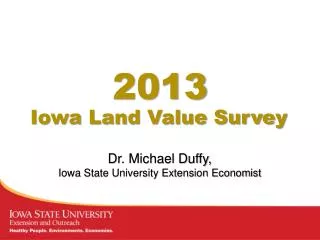
2013. Iowa Land Value Survey. Dr. Michael Duffy, Iowa State University Extension Economist. Statewide Average. $8,716. up 5.1% up $420. High Grade Land. $10,828. up 6.3% up $646. Medium Grade Land. $ 8,047. up 3.5% up $ 274. Low Grade Land. $ 5,298. up 3.5% up $ 179.

E N D
2013 Iowa Land Value Survey Dr. Michael Duffy, Iowa State University Extension Economist
Statewide Average $8,716 up 5.1% up $420
High Grade Land $10,828 up 6.3% up $646
Medium Grade Land $8,047 up 3.5% up $274
Low Grade Land $5,298 up 3.5% up $179
Northwest $10,960 high $12,824 med $9,918 low $6,845 up 2.8% up $83 down 3.9% down $445
North Central $9,818 high $11,159 med $8,824 low $6,421 up 2.7% up $258
Northeast $9,161 high $11,423 med $8,573 low $5,670 up 7.5% up $638
West Central $9,449 high $11,591 med $8,725 low $5,926 up 2.5% up $233
Central $9,877 high $11,803 med $8,930 low $5,918 up 5.5% up $512
East Central $9,327 high $11,631 med $8,567 low $5,449 up 10.8% up $906
Southwest $7,531 high $9,591 med $7,137 low $4,592 up 7.4% up $517
South Central $4,791 high $7,150 med $4,715 low $2,843 up 11.2% up $483
Southeast $6,994 high $9,785 med $6,605 low $3,651 up 13.3% up $822
AVERAGE VALUES all grades 1950−2013
PERCENTAGE CHANGE from previous year, 1951−2013
AVERAGE VALUES adjusted for inflation
PERCENTAGE CHANGE adjusted for inflation
POSITIVE FACTORS affecting land values
NEGATIVE FACTORS affecting land values
WHO PURCHASED farmland
WHO PURCHASED farmland
SALES ACTIVITY relative to previous year
CHANGE IN sales activity from previous year More – 9% Less – 59% Same – 33% More – 16% Less – 53% Same – 31% More – 20% Less – 43% Same – 37% More – 20% Less – 45% Same – 35% More – 18% Less – 40% Same – 41% More – 15% Less – 47% Same – 38% More – 16% Less – 48% Same – 36% More – 19% Less – 29% Same – 52% More – 8% Less – 71% Same – 20%
SUMMARY • 5.1% increase is 9th out of last 10 years • Except for 2009 first single digit increase since 2003 • Rate of increase slowed throughout the year mimicking drop in crop prices • NW Iowa showed actual declines in value • Gross farm income will be the factor to watch for future directions
For more information, visit www.extension.iastate.edu/topic/landvalue