Download
1 / 21
220 likes | 381 Vues
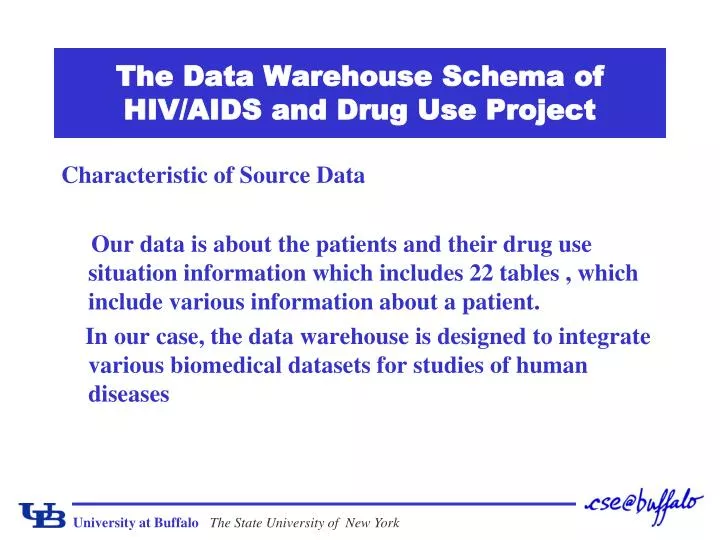
The Data Warehouse Schema of HIV/AIDS and Drug Use Project. Characteristic of Source Data Our data is about the patients and their drug use situation information which includes 22 tables , which include various information about a patient .

E N D
The Data Warehouse Schema of HIV/AIDS and Drug Use Project Characteristic of Source Data Our data is about the patients and their drug use situation information which includes 22 tables , which include various information about a patient. In our case, the data warehouse is designed to integrate various biomedical datasets for studies of human diseases
The Data Warehouse Schema of HIV/AIDS and Drug Use Project The Problem of the Clinical Data • Incomplete and/or imprecise data very common • Uncertain relationships between fact and dimension objects • The data structure is often informal • Often many-to-many relationships between measures and dimensions
The Data Warehouse Schema of HIV/AIDS and Drug Use Project The process of building up the data warehouse Step 1: Split the tables which are in 1NF(First normal form) Step 2:According to the situation, build up the measure tables Step 3: Solving the “many to many ” relationships in each diagram Step 4: Integration the measure tables to a fact table
The construction of the data warehouse Step 1: Split the tables which are in 1NF The defects may cause by the 1NF • Data Redundancy • Hard to Manage • Load Slowly
The construction of the data warehouse Step 2: According to the situation, build up the measure tables Since the tables can be basically classified into five categories in our data, then I have used five Measure tables :Personal Info, Medical History, Other Info, Labs and Tests, Medicines which can stand for these five categories and connect to the dimension table belong to it.
The Info about the five categories • Personal: Including 6 tables of patients’ personal information: Household Info, HIV Info, Substance, Address ,Insurance and Other Genotype • Medical History: Including 6 tables of patients’ medical history: MEDPROB, Adverse Effect,Extra Social History,Coinfection, Medical Problem, and Extra Social history. • Labs and Tests: Including 4 tables of patients’ labs and tests info: Genotype, Labs info, Phenotype and Drug monitor.
The Info about the five categories • Medicines : Including 6 tables of patients’ medical info: Prophyl , Allergies, HAART, ARV, Nutritional Supply and Other Medicines Info. • Consult and Service: Including 6 tables of patients’ Medical service and result:Services, Consults ,Consults Outcomes, Consults Assessment, Consults Recommendation and Program Affiliation.
The entity-relationship (ER) Diagrams of the five categories
The construction of the data warehouse Step 3: Solving the “many to many ” relationships in each diagram In order to solve the “many to many” relation between fact table and dimension table, We use the bridge table. Bridge Table is a kind of table exists between the fact table and dimension table whose relation is “many to many”.
The Flexibility of the bridge table 1. Solve the many-to-many relationship problem 2.Dimension table and its associated measure table can be populated independently 3. Avoid null values
The construction of the data warehouse Step 4: Integration the measure tables to a fact table Now that we’ve completed the design of five measure tables, it is time to integrate them together with a fact table.
The construction of the data warehouse Between the dimension tables and the fact table , I use the Bio-Star Schema .What’s more, as we mentioned before, all the tables own a TC_ID, then I use the Patient as the fact table, and the schema is shown as following:
Characteristic of the schema • Splitting the normal form 1NF help to decrease the redundancy of the data and easily management. • Try to maintain the structure of the original tables , which help the clients understand better. • Easily handle the many-to-many relationships. • BioStar schemas are able to capture the complex data structures and semantics.Themodel has the properties of great extensibility and flexibility to be widely applicable to biomedical data.