Download
1 / 23
230 likes | 351 Vues
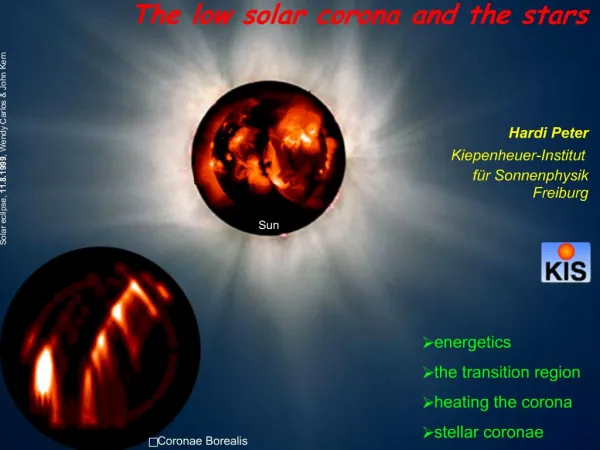
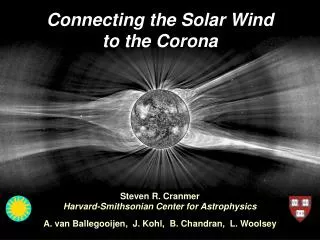
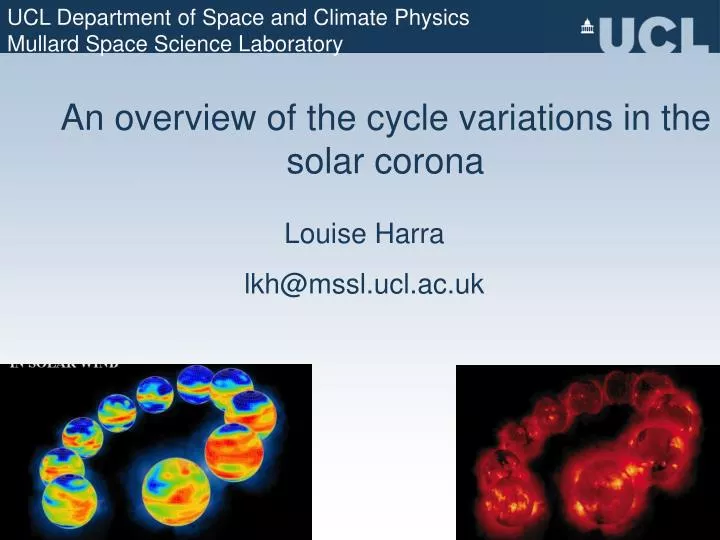
UCL Department of Space and Climate Physics Mullard Space Science Laboratory. An overview of the cycle variations in the solar corona. Louise Harra lkh @mssl.ucl.ac.uk. Extended solar minimum Hinode X-ray corona 2007 Oct. – 2009 Apr. The solar wind is weaker… . McComas et al., 2008.

E N D
UCL Department of Space and Climate Physics Mullard Space Science Laboratory An overview of the cycle variations in the solar corona Louise Harra lkh@mssl.ucl.ac.uk
Extended solar minimum Hinode X-ray corona 2007 Oct. – 2009 Apr.
Differences between previous minimum and this one • In this minimum the solar wind • Lower wind speed by 3% • Less dense (17%) • Cooler (14%) • Lower mass flux (20%) • Lower dynamic pressure (22%) • Lower thermal pressure (25%) • More fast/slow stream interaction regions (due to more mid-low latitude CHs The heliosphere is likely to be smaller now. Both polar and ecliptic observations show similar variations – the changes are global not just polar.
Solar cycle evolution of the solar wind The fast wind regions in ’08 show a marked increase at lower latitudes It also showed decrease at high latitudes. This difference is likely to be due to weaker polar fields during the ‘08 minimum. Tokumaru et al., 2010
Coronal magnetic fields:1996(CR1910)and 2008(CR2070) 1996 2008 Tokumaru et al., 2009
Solar minimum low in heliospheric magnetic field The peak B varies with cycle, but the minimum has stayed the same over the past 130 yrs. This past minimum it reached a new low – possibly due to lower CME rate?
Weakening of polar magnetic fields Polar magnetic fields formed through the transport of trailing magnetic flux from active regions to the poles. Simulations carried out between 1965 to present day and it was found that increasing the surface meridional flow by 15% can create current day behaviour. Wang, Robbrecht and Sheeley, 2009
Low latitude Coronal holes • The area occupied by CH is larger than in 2007 min. • This area is related to recurrence of 5 persistent CHs. • The Sun had a multi-pole structure during this time period – dominantly due to the weak polar fields. Abramenko et al., 2010
Coronal holes forming after active region decay The CHs develop both in the leading and lagging polarities of AR. Karachik, Pevstov and Abramenko, 2010
The CHs have their magnetic field closed on the N polar CH. • The change from E-W to N-S may indicate a transformation from toroidal to poloidal field (Babcock-Leighton model?). • This was observed at solar minimum or the onset of the cycle 24. • The poles were showing a flux imbalance – the linkage from the CH to the N pole reduces this imbalance.
Early signs of solar cycle 25?? • Wilson et al. (1988) found that each cycle of solar activity begins at polar latitudes. • New results have shown that flux emergence in coronal holes is already showing the appearance of cycle 25! Savcheva et al., 2009
Mid-range Periodicities in activity • Solar flare index is ~ proportional to the total energy of a flare = it (i, intensity in Hα , t is duration in minutes). • Well established periodicities are 27 days and 11 years. • Mid-range periodicities have been found in Hα, HXR peak rate, 10.7 cm radio peak flux, energetic electrons all show 153 day periodicity. • Additional 323 and 540 day periodicity has been found in daily sunspot number and area. • Quasi-period of 157 days found in flares > M5. • Recent re-evaluation of cycles 21-23 by Kilcik et al (2010) found prominent periods of 152 days for cycle 21, 73 days for cycle 22 and 62 days for cycle 23.
North-south asymmetry in cycle 23. Either one or other hemisphere has dominant activity at different parts of the cycle. The switch between dominant hemispheres is very quick, and the persistent longitudes last for 1-1.5 years. Rotation parameters for sunspots suggest that the northern hemisphere rotated faster than the southern during the past 3 cycles (Zhang et al., 2011) Zharkov and Zharkova, 2011
X-flares can occur at any stage of the cycle. Hathaway, 2010
When do large flares occur in the cycle? A tendency exists that the more powerful a flare the later it takes place in the cycle. The most powerful flares take place in the decay phase of the cycle. (Tan, 2011).
Influence of the lower atmosphere Detection of a signal of visible irradiance has been found even for C-class flares. An estimate of 70% of the total energy of flares was determined to be from WL continuum. The lower solar atmosphere behaviour is important in understanding flare energetics. (Kretzschmar, 2011)
From 1976-2010, the flares and sunspot number correlated at 94.8% The baseline level of geomagnetic activity also increases when sunspot number increases. Hathway, 2010
CME occurrence rate The occurrence rate tracks solar cycle but with a peak delay of 6-12 mnths. CME rate increases from 0.5/day to ~6/day.
Cycle behaviour of magnetic clouds Fluxropes are complicated, but many reflect the magnetic field of their source regions. The poloidal field of MCs exhibits a polarity reversal during the 22yr Hale cycle. This provides evidence that CMEs preferentially remove the like polarity of the solar dipole field and support CME participation in the solar cycle.
Minima in geomagnetic activity occur just after those in sunspot number. Geomagnetic activity tends to stay high during the decay phase – maybe due to low latitude CHs.