Download
1 / 70
780 likes | 1.53k Vues
Chapter 6 Strategy Analysis & Choice. Strategic Management: Concepts & Cases 11 th Edition Fred David. Chapter Outline. The Nature of Strategy & Choice. A Comprehensive Strategy-Formulation Framework. The Input Stage. Chapter Outline ( cont’d ). The Matching Stage. The Decision Stage.

E N D
Chapter 6Strategy Analysis & Choice Strategic Management: Concepts & Cases 11th Edition Fred David Copyright 2007 Prentice Hall
Chapter Outline The Nature of Strategy & Choice A Comprehensive Strategy-Formulation Framework The Input Stage Copyright 2007 Prentice Hall
Chapter Outline (cont’d) The Matching Stage The Decision Stage Cultural Aspects of Strategy Choice Copyright 2007 Prentice Hall
Chapter Outline (cont’d) The Politics of Strategy Choice Governance Issues Copyright 2007 Prentice Hall
Strategy Analysis & Choice To acquire or not to acquire, that is the question –Robert J. Terry Life is full of lousy options – General P.X. Kelley Copyright 2007 Prentice Hall
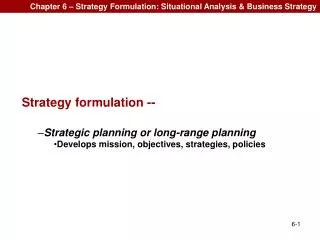
Strategy Analysis & Choice --Establishing long-term objectives -- Generating alternative strategies -- Selecting strategies to pursue -- Best alternative - achieve mission & objectives Nature of Strategy Analysis & Choice Copyright 2007 Prentice Hall
Strategy Analysis & Choice Alternative Strategies Derive From -- • Vision • Mission • Objectives • External audit • Internal audit • Past successful strategies Copyright 2007 Prentice Hall
Strategy Analysis & Choice Generating Alternatives -- Participation in generating alternative strategies should be as broad as possible Copyright 2007 Prentice Hall
Comprehensive Strategy-Formulation Framework Stage 1:The Input Stage Stage 2:The Matching Stage Stage 3:The Decision Stage Copyright 2007 Prentice Hall
Strategy-Formulation Analytical Framework Internal Factor EvaluationMatrix (IFE) Stage 1:The Input Stage External Factor EvaluationMatrix (EFE) Competitive Profile Matrix(CPM) Copyright 2007 Prentice Hall
Stage 1: The Input Stage • Basic input information for the matching & decision stage matrices • Requires strategists to quantify subjectivity early in the process • Good intuitive judgment always needed Copyright 2007 Prentice Hall
Strategy-Formulation Analytical Framework SWOT Matrix SPACE Matrix Stage 2:The Matching Stage BCG Matrix IE Matrix Grand Strategy Matrix Copyright 2007 Prentice Hall
Stage 2: The Matching Stage • Match between organization’s internal resources & skills and the opportunities & risks created by its external factors Copyright 2007 Prentice Hall
Stage 2: The Matching Stage SWOT Matrix • Strengths • Weaknesses • Opportunities • Threats Copyright 2007 Prentice Hall
SWOT Matrix Four Types of Strategies • Strengths-Opportunities (SO) • Weaknesses-Opportunities (WO) • Strengths-Threats (ST) • Weaknesses-Threats (WT) Copyright 2007 Prentice Hall
SO Strategies StrengthsWeaknessesOpportunities ThreatsSWOT Use a firm’sinternal strengthsto take advantageof external opportunities SOStrategies Copyright 2007 Prentice Hall
WO Strategies StrengthsWeaknessesOpportunities ThreatsSWOT Improving internalweaknesses bytaking advantageof externalopportunities WOStrategies Copyright 2007 Prentice Hall
ST Strategies StrengthsWeaknessesOpportunities ThreatsSWOT Use a firm’s strengthsto avoid orreduce the impactof externalthreats STStrategies Copyright 2007 Prentice Hall
WT Strategies StrengthsWeaknessesOpportunities ThreatsSWOT Defensive tacticsaimed at reducinginternal weaknesses & avoidingenvironmentalthreats WTStrategies Copyright 2007 Prentice Hall
SWOT Matrix Developing the SWOT • List firm’s key internal Strengths • List firm’s key internal Weaknesses • List firm’s key external Opportunities • List firm’s key external Threats Copyright 2007 Prentice Hall
SWOT Matrix Copyright 2007 Prentice Hall
Excess working capacity (strength) + 20% annual growth in the cell phone industry (opportunity) = Acquire Cellfone, Inc. Insufficient capacity (weakness) + Exit of two major foreign competitors from the industry (opportunity) = Pursue horizontal integration by buying competitor's facilities Strong R&D (strength) + Decreasing numbers of young adults (threat) = Develop new products for older adults Poor employee morale (weakness) + = Develop a new employee benefits package Strong union activity (threat) Matching Key Factors to Formulate Alternative Strategies Key Internal Factor Key External Factor Resultant Strategy Copyright 2007 Prentice Hall
Limitations with SWOT Matrix • Does not show how to achieve a competitive advantage • Provides a static assessment in time • May lead the firm to overemphasize a single internal or external factor in formulating strategies Copyright 2007 Prentice Hall
Strategy-Formulation Analytical Framework SWOT Matrix SPACE Matrix Stage 2:The Matching Stage BCG Matrix IE Matrix Grand Strategy Matrix Copyright 2007 Prentice Hall
SPACE Matrix Strategic Position & Action Evaluation Matrix • Aggressive • Conservative • Defensive • Competitive Copyright 2007 Prentice Hall
SPACE Matrix Two Internal Dimensions • Financial Strength (FS) • Competitive Advantage (CA) Copyright 2007 Prentice Hall
SPACE Matrix Two External Dimensions • Environmental Stability (ES) • Industry Strength (IS) Copyright 2007 Prentice Hall
Internal Strategic Position External Strategic Position Financial Strength (FS) Return on investment Leverage Liquidity Working capital Cash flow Environmental Stability (ES) Technological changes Rate of inflation Demand variability Price range of competing products Barriers to entry Competitive pressure Price elasticity of demandEase of exit from market Risk involved in business SPACE Factors Copyright 2007 Prentice Hall
Internal Strategic Position External Strategic Position Competitive Advantage CA Market share Product quality Product life cycle Customer loyalty Competition’s capacity utilization Technological know-how Control over suppliers & distributors Industry Strength (IS) Growth potential Profit potential Financial stability Technological know-how Resource utilization Ease of entry into market Productivity, capacity utilization SPACE Factors Copyright 2007 Prentice Hall
Steps to Developing a SPACE Matrix • Select a set of variables to define FS, CA, ES, & IS • Assign a numerical value: • From +1 to +6 to each FS & IS dimension • From -1 to -6 to each ES & CA dimension • Compute an average score for each FS, CA, ES, & IS Copyright 2007 Prentice Hall
Steps to Developing a SPACE Matrix • Plot the average score on the appropriate axis • Add the two scores on the x-axis and plot the point. Add the two scores on the y-axis and plot the point. Plot the intersection of the new xy point • Draw a directional vector from the origin through the new intersection point. Copyright 2007 Prentice Hall
SPACE Matrix FS Conservative Aggressive +6 +5 +4 +3 +2 +1 CA IS -6 -5 -4 -3 -2 -1 +1 +2 +3 +4 +5 +6 -1 -2 -3 -4 Defensive -5 Competitive -6 ES Copyright 2007 Prentice Hall
Strategy-Formulation Analytical Framework SWOT Matrix SPACE Matrix Stage 2:The Matching Stage BCG Matrix IE Matrix Grand Strategy Matrix Copyright 2007 Prentice Hall
BCG Matrix Boston Consulting Group Matrix • Enhances multi-divisional firm in formulating strategies • Autonomous divisions = business portfolio • Divisions may compete in different industries • Focus on market-share position & industry growth rate Copyright 2007 Prentice Hall
BCG Matrix Relative Market Share Position • Ratio of a division’s own market share in an industry to the market share held by the largest rival firm in that industry Copyright 2007 Prentice Hall
Stars II Question Marks I Cash Cows III Dogs IV BCG Matrix Relative Market Share Position High 1.0 Medium .50 Low 0.0 Industry Sales Growth Rate High +20 Medium 0 Low -20 Copyright 2007 Prentice Hall
BCG Matrix Question Marks • Low relative market share – compete in high-growth industry • Cash needs are high • Case generation is low • Decision to strengthen (intensive strategies) or divest Copyright 2007 Prentice Hall
BCG Matrix Stars • High relative market share and high growth rate • Best long-run opportunities for growth & profitability • Substantial investment to maintain or strengthen dominant position • Integration strategies, intensive strategies, joint ventures Copyright 2007 Prentice Hall
BCG Matrix Cash Cows • High relative market share, competes in low-growth industry • Generate cash in excess of their needs • Milked for other purposes • Maintain strong position as long as possible • Product development, concentric diversification • If weakens—retrenchment or divestiture Copyright 2007 Prentice Hall
BCG Matrix Dogs • Low relative market share & compete in slow or no market growth • Weak internal & external position • Liquidation, divestiture, retrenchment Copyright 2007 Prentice Hall
Strategy-Formulation Analytical Framework SWOT Matrix SPACE Matrix Stage 2:The Matching Stage BCGMatrix IEMatrix Grand Strategy Matrix Copyright 2007 Prentice Hall
The Internal-External Matrix • Positions an organization’s various divisions in a nine-cell display • Similar to BCG Matrix except the IE Matrix: • Requires more information about the divisions • Strategic implications of each matrix are different Copyright 2007 Prentice Hall
IE Matrix • Based on two key dimensions • The IFE total weighted scores on the x-axis • The EFE total weighted scores on the y-axis • Divided into three major regions • Grow and build – Cells I, II, or IV • Hold and maintain – Cells III, V, or VII • Harvest or divest – Cells VI, VIII, or IX Copyright 2007 Prentice Hall
Strategy-Formulation Analytical Framework SWOT Matrix SPACE Matrix Stage 2:The Matching Stage BCG Matrix IE Matrix Grand Strategy Matrix Copyright 2007 Prentice Hall
Grand Strategy Matrix • Tool for formulating alternative strategies • Based on two dimensions • Competitive position • Market growth Copyright 2007 Prentice Hall
RAPID MARKET GROWTH • Quadrant II • Market development • Market penetration • Product development • Horizontal integration • Divestiture • Liquidation • Quadrant I • Market development • Market penetration • Product development • Forward integration • Backward integration • Horizontal integration • Concentric diversification WEAK COMPETITIVE POSITION STRONG COMPETITIVE POSITION • Quadrant III • Retrenchment • Concentric diversification • Horizontal diversification • Conglomerate diversification • Liquidation • Quadrant IV • Concentric diversification • Horizontal diversification • Conglomerate diversification • Joint ventures SLOW MARKET GROWTH Copyright 2007 Prentice Hall
Grand Strategy Matrix Quadrant I • Excellent strategic position • Concentration on current markets/products • Take risks aggressively when necessary Copyright 2007 Prentice Hall
Grand Strategy Matrix Quadrant II • Evaluate present approach • How to improve competitiveness • Rapid market growth requires intensive strategy Copyright 2007 Prentice Hall