Download
1 / 16
160 likes | 257 Vues
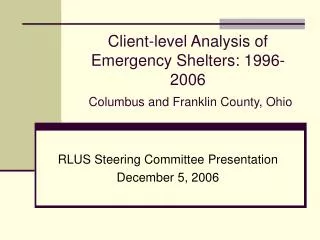
Emergency Shelter Inventory Columbus and Franklin County, Ohio. RLUS Steering Committee Presentation December 5, 2006. Prepared for the Rebuilding Lives Updated Strategy Steering Committee Prepared by the Center for Urban Community Services. Goals of the Inventory.

E N D
Emergency Shelter InventoryColumbus and Franklin County, Ohio RLUS Steering Committee Presentation December 5, 2006
Prepared for the Rebuilding Lives Updated Strategy Steering Committee Prepared by the Center for Urban Community Services
Goals of the Inventory Understand system change from ’98 to ‘06 • Total inventory and beds targeted to specific populations • Distribution by zip code • Total investments by public and private funding sources (2/07) • Average daily cost per unit (2/07)
Data Sources • HUD Shelter Inventories from 1998 to 2006 • CSB partner agency contracts and budgets • Agency funding reports
Key Findings – Comparison of ’98 to ‘06 • Capacity remained relatively stable – Increase in total units of 7%. • Growth in units serving families (14%) and single women (63%) outpaced growth in the system as a whole. • Bed distribution by gender shifted over time: • Beds designated for women increased from 14% of total singles beds to19%. • Beds designated for men decreased from 84% of total singles beds to 78%.
Key Findings – Comparison of ’98 to ‘06 • Capacity to serve public inebriates more than doubled from ’98 (n=24) to ’06 (n=50). • Units were more evenly distributed across zip codes in ’06: • 66% of units were located in zip code 43215 in ’98. • 29% of units were located in zip code 43215 in ’06.
Total System Overview – ’98 to ‘06 • 12 emergency shelter programs with capacity to serve 619 households in ’98. • Peak capacity occurred in ’02 at 746 households (increase 21% from ’98). • 13 programs with capacity to serve 663 households (increase 7% from ’98, decrease 11% from ’02). • 6 shelters closed and 7 opened
Family System Overview • 5 programs with capacity to serve 111 families in ‘98. • Family capacity peaked in 2006 when 4 programs had 127 family units (increase 14% from ’98)
Targeted Sub-populations • The number of domestic violence units has remained steady at 34 units. • The number of units for public inebriates has more than doubled. • Youth beds increased by 33% - from12 to 16 units.
Unit Distribution by Zip Code DATA UPDATED SINCE 11/27/06 DRAFT REPORT
Next Steps • Analysis of resources invested over time • Development of average cost per shelter unit for adults and families • Using client data, review outcomes of specific programs
Questions or Comments? Contact: Lauren Bholai-Pareti CUCS Housing Resource Center 120 Wall Street, 25th Floor New York, NY 10005 www.cucs.org Tel: (212) 801-3355 Fax: (212) 801-3325 Email: lpareti@cucs.org