Download
1 / 28
280 likes | 470 Vues
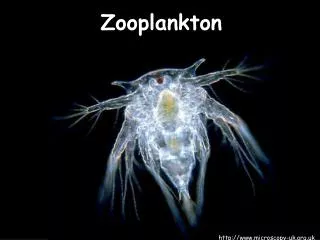
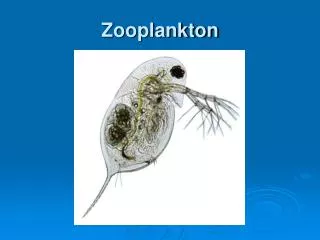
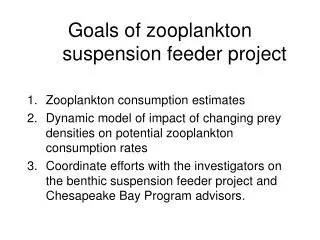
Ecological efficiency. Ecological efficiency of zooplankton is usually around 10% of NPP in lakes. Fecal pellets. Zooplankton such as Daphnia filter-feed using currents generated by their thoracic appendages. Fecal pellets sediment rapidly to the bottom.

E N D
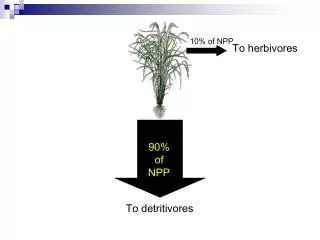
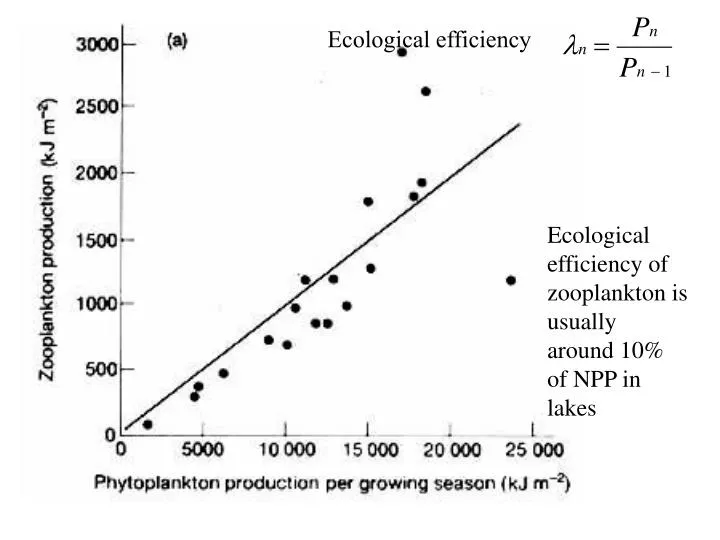
Ecological efficiency Ecological efficiency of zooplankton is usually around 10% of NPP in lakes
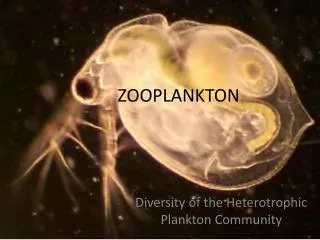
Fecal pellets Zooplankton such as Daphnia filter-feed using currents generated by their thoracic appendages. Fecal pellets sediment rapidly to the bottom
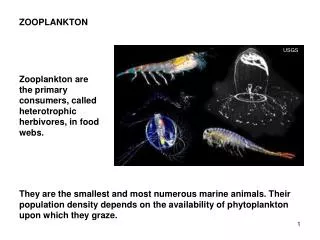
80-95% of energy is lost at each trophic step, much of it as feces Fecal pellets Assimilation efficiency Herbivores ≈100% for sugary nectar ≈40-80% for small phytoplankton and filamentous algae <20% for mud and detritus Carnivores 60-70% for aquatic insects 70-90% for meat The undigested material in the zooplankton fecal pellets was not assimilated. Assimilation efficiency depends on the digestibility of the diet Cellulose or other undigestible material makes AE low Ingested energy ─ egested energy = assimilated energy Assimilation efficiency (AE, %)= assimilated energy/ingested energy x 100
Exploitation efficiency or Consumption Efficiency (EE) Exploitation efficiency is the consumption rate at a given trophic level divided by the productivity of the trophic level it feeds on. If EE for herbivores is low then plant detritus will be readily available for detritivores. Zooplankton will have low EE (CE) when phytoplankton are sedimenting rapidly to the bottom before they are being eaten. If EE(CE) is high then most of the sedimentation will be in the form of fecal pellets, which sink more rapidly than individual cells. Zooplankton fecal pellets are good food for benthic invertebrates
Activity is energetically expensive and high Metabolic rate means low Production efficiency Gross PE Endotherms ≈5% or less ≈1% some birds Ectotherms ≈10-30% for fish ≈ 5-15% insects Otter swim about rapidly and spend large amounts of energy looking for fish to eat Assimilated energy ─ respiration ─ excretion = production (growth) Net Production efficiency (NPE, %)= growth/assimilation x 100 Gross PE (%)=[assim/ingest x growth/assim] x100=growth/ingest x 100
Energy budget for herbivorous zooplantkon NPP = rate of formation of phytoplankton biomass S = rate of production of uneaten algae, mostly inedible species (sedimentation) F= rate of production of fecal pellets (sedimentation) Metabolic costs include basal metabolism, activity costs and specific dynamic action (costs of digestion etc) Zooplankton production is the rate at which biomass (energy) becomes available for consumption by zooplanktivores ZP/NPP = 0.05-0.20 but usually averages around 0.1
If the productivity of a phytoplankton population is 4000 k J (kilo Joules) /yr / m2, If sedimentation rate of dead cells to the substrate constitutes 1600 kJ/m2yr, and the phytoplankton population is dB/dt=0. If the rain of zooplankton fecal pellets to the bottom is 1400 kJ/m2/yr. What is the assimilation efficiency of the zooplankton trophic level (assume that they are all feeding on phytoplankton). 0.42 or 42% 0.60 or 60% 0.35 or 35% 0.25 or 25% None of these What is the exploitation efficiency EE (or Consumption efficiency CE) of the zooplankton trophic level 0.42 or 42% 0.60 or 60% 0.35 or 35% 0.25 or 25% None of these
If the net production efficiency of the zooplankton trophic level is 0.40 (40%) what is the ecological efficiency (l) of the trophic level 0.15 or 15% 0.05 or 5% 0.10 or 10% 0.25 or 25% None of these If the zooplanktivorous fish are consuming zooplankton at the rate of 400 kJ/yr/m2, their EE (CE) is 0.40 or 40% 0.60 or 60% 1.00 or 100% 0.25 or 25% None of these
If the zooplanktivorous fish have an assimilation efficiency of 0.70 (70%) and Net production efficiency (NPE) of 0.20 (20%), the productivity at this trophic level is 40 kJ/yr/m2 56 kJ/yr/m2 100 kJ/yr/m2 280 kJ/yr/m2 None of these If in another lake with similar zooplankton productivity the planktivore fish productivity was 2 X higher, a possible explanation for this would be the AE of the fish in that lake was 2X as high the NPE of the fish in that lake was 2X as high the EE (CE) in that lake was 2X as high the AE*NPE in that lake was 2X as high both b and d are true both b and c are true
Energy budget for herbivorous zooplantkon NPP = rate of formation of phytoplankton biomass S = rate of production of uneaten algae, mostly inedible species (sedimentation) F= rate of production of fecal pellets (sedimentation) Metabolic costs include basal metabolism, activity costs and specific dynamic action (costs of digestion etc) Zooplankton production is the rate at which biomass (energy) becomes available for consumption by zooplanktivores ZP/NPP = 0.05-0.20 but usually averages around 0.1
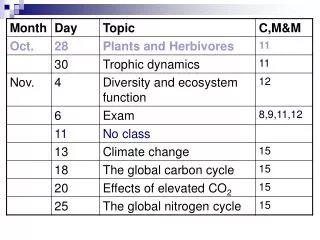
Textbook Chapters since the last mid-term Chapter 17: Phosphorus concentrations and cycling Chapter 14: Carbon and pH Chapter 15: Dissolved oxygen Chapter 16: Oxidation-reduction potential Chapter 18: Nitrogen cycling Chapter 21: The Phytoplankton—21:12-21:15 Chapter 23: The zooplankton Chapter 26: Fish and Aquatic birds Chapter 27:Acidification of waterways Chapter 29: Reservoirs
Energetic losses in the food chain Less than 1% of the incident light energy is captured by photosynthesis as NPP. Productivity declines by about 10-fold for each trophic level in the food chain. Most of the losses are are in the form of waste heat. Some energy from each trophic level winds up in the detrital pool, and some of this remains buried as sediment (or soil) organic matter (fossilized)
Yields of piscivorous fish are well correlated with primary productivity but are several orders of magnitude lower than PP because food chains are long and Trophic efficiencies are low
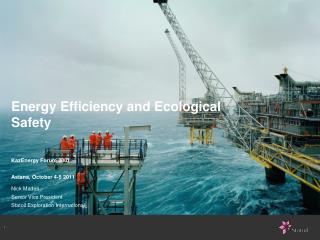
Intensive aquaculture can produce yields that are orders of magnitude beyond natural ecosystems Figure 26-19 How to maximize energy flow to fish Increased nutrient loading—fertilization + ammonia and anoxia tolerant species Shortening the food chain—primaryconsumers (eg carps, tilapia or mullets) Don’t rely on natural recruitment and managing the life cycle--stocking Increasing consumption efficiency—small pens intensive feeding Increased assimilation efficiency—feeding with easy to digest food pellets Increased production efficiency—low activity species that don’t mind crowding, , highly turbid water
Many aquaculture proponents argue that aquaculture reduces harvesting pressure on wild fisheries. Salmonid aquaculture not very trophically efficient, food pellets made from by-catch of wild species Major water quality issues—nutrientpollution from cages, anti-fouling paint, antibiotics, habitat destruction Transmit diseases to wild salmonids—bacteria, viruses, protozoans, fungi, “fish lice” –parasitic copepods and other Crustacea Genetic problems when domestic escapees compete with or interbreed with wild fish Lepeophtheirus salmonis Argulus
Energy budget for herbivorous zooplantkon NPP = rate of formation of phytoplankton biomass S = rate of production of uneaten algae, mostly inedible species (sedimentation) F= rate of production of fecal pellets (sedimentation) Metabolic costs include basal metabolism, activity costs and specific dynamic action (costs of digestion etc) Zooplankton production is the rate at which biomass (energy) becomes available for consumption by zooplanktivores ZP/NPP = 0.05-0.20 but usually averages around 0.1
Pelagic fish like kokanee salmon expend a huge amount of energy actively searching for prey--they have high basal metabolic rates low conversion efficiencies The deepwater sculpin sits on the bottom and ambushes unsuspecting prey. They have very low basal metabolic rates and high conversion efficiencies If these two species were fed the same amount of food, the sculpin would grow more than twice as fast as the salmon
In order to keep growing carnivorous fish usually need to switch to larger and larger prey If they do not, the activity costs escalate rapidly, and fish fail to grow (stunting) Thus trophic position usually increases as the fish matures. Sherwood et al. 2002, Can. J. Fish. Aquat. Sci, see my web page http://people.uleth.ca/~joseph.rasmussen/
Benthic & epiphytic invertebrates Zooplankton Benthic & epiphytic algae plus detritus Phytoplankton Diet shift Trophic link Productivity at different levels in the food web 500 x (0.1)3g/m2/yr 500 x (0.1)2g/m2/yr 500 x 0.1 g/m2/yr NPP around 500 g/m2/yr Net productivity at level n = the rate of growth of biomass at that level = [SGR +GSI] * Biomass = NPP (TE) n-1
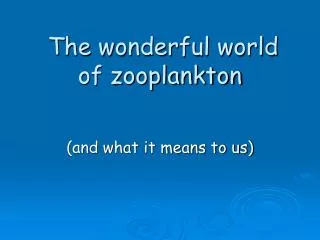
Classenia, a predatory stonefly, and some of the stream insect larvae that it preys on
Stoneflies prefer prey that are near the energetically optimum size, when they are given the opportunity to select from a variety of sizes. Data from Allan, JD. 1995. Stream Ecology, Chapman and Hall. Ch. 7
Residence time and turnover of energy by trophic levels The standing stock of energy in the plankton is low but it is turned over rapidly, because the organisms are small, grow rapidly and don’t live long A Phytoplankton (0.01mg, life span, few days H2 H1 Planktonic Herbivore (50mg) life span 1 month Benthic Detritivore (0.1 g) life span 1yr P Carnivorous fish (100g) life span 5-10 yr Turnover is slower at higher trophic levels, since larger organisms accumulate energy over a longer life span—longer residence time and slower turnover
More definitions Residence time is long and BAR are high when organisms are large and live long
Benthic & epiphytic invertebrates Zooplankton Benthic & epiphytic algae plus detritus Phytoplankton Diet shift Trophic link Productivity at different levels in the food web 500 x (0.1)3g/m2/yr 500 x (0.1)2g/m2/yr 500 x 0.1 g/m2/yr NPP around 500 g/m2/yr Net productivity at level n = the rate of growth of biomass at that level = [SGR +GSI] * Biomass = NPP (TE) n-1
The Biomass Accumulation Ratio varies with ecosystem type Ecosystems with largest primary producers have highest BAR Aquatic systems have lower BAR Primary producers in Aquatic ecosystems are plankton and aquatic macrophytes which are smaller than most trees The smallest phytoplankton are found in the open ocean
Allochthonous energy input is important in small forested streams Allochthonous input makes an important contribution to primary consumers in small tributaries, but much less so farther down the river. Small tributaries are usually lined with overhanging trees whose leaves fall into the stream, and the shade limits primary production within the stream. Allochthonous production is energy fixed outside the system, eg leaves from the stream bank fall into the stream, decompose and support primary consumers, or insects from the bank fall in and feed the fish Autochthonous energy is energy produced within the stream by benthic algae or mosses growing on the rocks