Download
1 / 18
180 likes | 565 Vues
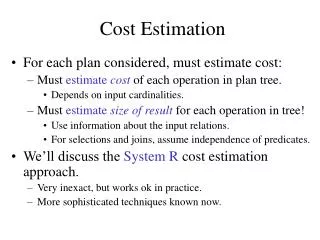
COST ESTIMATION. Basics, COCOMO, FP. What is estimated?. TIME <=> MONEY TIME: duration , chronological weeks, months, years effort , person-month (man-month) unit is typically month (year). Basic Relation. person-month / nbr-of-people = duration example:

E N D
COST ESTIMATION Basics, COCOMO, FP
What is estimated? • TIME <=> MONEY • TIME: • duration, chronological weeks, months, years • effort, person-month (man-month) • unit is typically month (year)
Basic Relation • person-month / nbr-of-people = duration • example: • 36 person-month, 1 developer, 36 month • 36 person-month, 2 people, 18 month • 36 person-month, 12 people, 3 month • Beware of the “million monkey” syndrome [Brooks]
Basic Principles - Decomposition • It is easier to estimate time & cost for a smaller unit than to estimate time & cost for the complete system. • Estimation by decomposition: • Decompose your system or development process, estimate time & cost for the parts and summarize.
Basic Principles - Empirical Knowledge • Find parameters which characterise your system and derive time & cost based on a documented case history. • Empirical model: • time = function (parameters) • You rely on a correlation between time & cost and the set of independent parameters
Typical Parameters • number and complexity of functions • number and complexity of modules • number of lines of code (LOCS) • number and duration of steps in your development process • skills and technologies involved
When to do your estimate • the later the more accurate your parameters • early estimate: • you need to estimate your parameters • divide an conquer strategy • garbage in => garbage out • keep your estimate up-to-date
COCOMO [B. Boehm] • COnstructive COst MOdel • empirical method • hierarchy of COCOMO models (parameters) • basic: prg size • intermediate: prg size & cost drivers • advanced: prg size & cost drivers per phaseCost Drivers: Personnel/Team Capability, Product Complexity, Req. Reliability, Problem Domain Experience, Development practices, Tools, Language Experience, etc. • for each project type
COCOMO - Parameters • prg size: LOCS (lines of code) • “cost drivers” • evaluate: • product, hardware, personnel, project • measured on a 6 point scale • allow for derivation of an EAF • (Effort Adjustment Factor)
COCOMO - Project Types • organic mode: • relatively small and simple • small team of skilled developers • semi-detached: • intermediate in size and complexity • mixed skill levels on the team • embedded: • hard constraints for HW, SW, operation
Basic COCOMO - The Functions person-month = a*(KLOC)b duration-in-month = c*(person-month)d KLOC ... kilo lines of code a, b, c, d depend on the project type
Basic COCOMO - Tables project type: a b c d organic 2.4 1.05 2.5 0.38 semi-detached 3.0 1.12 2.5 0.35 embedded 3.6 1.20 2.5 0.32
Basic Cocomo - Example • You must decide on: • LOCS: 50,000 lines of code • project type: semi-detached • person-month: 3.0*(50)1.12 ~ 240 • duration-in-month: 2.5*(240)0.35 ~ 17 • number of people: 240 / 17 ~ 14
Function Points (FP) • Based on the number and complexity of the system functions to be delivered to the customer • Steps: • (1) Categorize the functions according to type (input, output, database, interface, etc.) and complexity (simple, moderate, average, complex, highly complex) • (2) Derive the number of function points: multiply the number of functions in each category by the appropriate complexity weights and total the number of PF • (3) Determine the total Project Influence Factors (PIF): PIF types (distributed processing,multiple development sites, etc.), and levels of difficulty ( from 0-no difficulty, to 3-average difficulty, to 5- great difficulty) • (4) Compute the Total Effort: PM = .036 * FP * PIF
Function Diff. Level Number Complexity FP M 2 Input 3 6 A 4 DB 10 40 Output S 4 3 12 58 Total PIF Total FP: Example All values from FP tables. (1&2) PF (3) PIF (4) Total Effort Difficulty Level 2 Data performance objectives Multiple sites 5 7 PM = 0.036*58*7 = 14.616
Function Points: Evaluation • Tightly coupled with Functional Requirements (see SRS) - works well with DFDs • Intuitive Method - makes intuitive sense to the customers • Notice: A rough estimate of the functional requirements will yield ONLY a very rough estimate of total effort
“3 Time Programming” Rule • Estimate the number of software modules/programs and their complexity • Estimate the effort required to complete coding and debugging of each module and the total programming effort • Total Project Effort = (Estimated Programming Effort) * 3 This includes Management, Documentation, Design, …. => Helpful ONLY to experienced programmers => Corrects at least the OPTIMISTS A “Rough Guess” is better than a “Wild Guess” or “No Estimate”
It Couldn’t be More Simple: Just Try Doing It!