Download
1 / 18
180 likes | 293 Vues
ELECTRIC POWER INDUSTRY OF SERBIA Head Department for Electricity Trade THE TENTH SESSION OF THE SOUTH -E AST EUROPE AN CLIMATE OUTLOOK FORUM (SEECOF- 10 ) Belgrade, Serbia, November 2 0 - 21 , 201 3. Influence of Meteorological Factors on Electric Energy Consumption

E N D
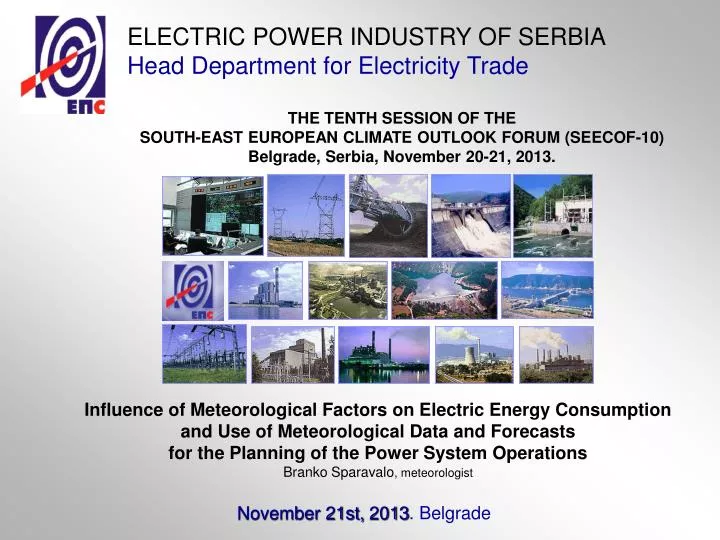
ELECTRIC POWER INDUSTRY OF SERBIA Head Department for Electricity Trade THE TENTH SESSION OF THE SOUTH-EAST EUROPEAN CLIMATE OUTLOOK FORUM (SEECOF-10) Belgrade, Serbia, November 20-21, 2013. Influence of Meteorological Factors on Electric Energy Consumption and Use of Meteorological Data and Forecasts for the Planning of the Power System Operations Branko Sparavalo, meteorologist November 21st, 2013. Belgrade
Head Department for Electricity Trade LEVELS OF POWER SYSTEM OPERATION PLAN: • ANNUAL • SEASONAL • MONTHLY • WEEKLY • DAILY For each level we prepare meteorological and hydrological forecasts of different scales, from one hour to the average monthly, seasonal and annual values.
THE MAIN METEOROLOGICAL FACTORSOF CONSUMPTION INCREASE IN SERBIA Head Department for Electricity Trade • TEMPERATURE • HIGH WIND • DAYLIGHT CLOUDINESS • PRECIPITATION
TEMPERATURE EFFECT ONCONSUMPTION INCREASE IN SERBIA Head Department for Electricity Trade WINTER TIME - DAILY ∆T = -1 oC →Consumption = +1.5 to +2.5 GWh (i.e. 1.5% to 2.5% higher comsumption) Example: 7. November 2011. T= 10 oC → Consumption = 105 GWh 21. november 2011. T= 0 oC → Consumption = 125 GWh (+20%) SUMMER TIME - DAILY ∆T= +1 oC → Consumption = +0.8to 1.2 GWh (i.e. 0.8% to 1.2% higher comsumption) Several years ago it was 0.7 GWh but now is about 1.0 GWh
SUMMER TIME - DAILY Head Department for Electricity Trade 5
TEMPERATURE EFFECT ONCONSUMPTION INCREASE IN SERBIA Head Department for Electricity Trade • WINTER TIME - MONTHLY November mean temperature in Belgrade T= 7.1 oC (1981-2010.) November 2010. T = 12.2 oC → second hotest november ever and the first november warmer than october in the same year Consumption = 2953 GWh November 2011. T = 4.6 oC Consumption = 3370 GWh ∆T = 7.6 oC ∆Consumption = 417 GWh i.e. 14% higher 2011. year Thats production of TENT B 600 MW for a month
THE INFLUENCE OF TEMPERATURE TREND ON CONSUMPTION DURING THE MONTH Head Department for Electricity Trade September mean temperature in Belgrade T= 18.0 oC (1981-2010.) Sep 2008. 17.1 oC → 2556 GWh (+8% than average with “normal” month) Because: 1.-12.9. Tave=25.0 C (increased use od Air Conditioners) 14.-22.9. Tave=10.6 C (13.-30.9. T=11.8 C) (used electricity for heating houses)
THE INFLUENCE OF DRY AND WET YEAR ON HYDRO POWER PRODUCTION IN SERBIA Head Department for Electricity Trade • 10.5 TWh → Average annualy Hydro Power production (30% of all power production) • 8.5 TWh → DRY year → 2011. • 12.5 TWh → WET year → 2010. • 4 TWh → The difference between DRY and WET year in money, 4 TWh= 200 million EUR (mean value at the EU electricity market)
Head Department for Electricity Trade SYSTEM FOR THE FORECAST OF THEDRINA RIVER BASIN INFLOW - METEOSAR HE “BAJINA BAŠTA”
SYSTEM FOR THE FORECAST OF THE DRINA RIVER BASIN INFLOW - METEOSAR Head Department for Electricity Trade • System was developed to provide operational river forecasting for making hydropower operating plans • Main INPUT: forecasts of precipitation and temperature using several meteo models • 6h time step discretization up to xx days (7-10+) • The river basin divided into altitude zones through performed snowmelt process and also accumulation of snow above a certain level • Model calculates runoff from rainfall and melting snow
SYSTEM FOR THE FORECAST OF THE DRINA RIVER BASIN INFLOW - METEOSAR System is used for: HYDROPOWER OPERATING PLANS HYDROPOWER COORDINATION WATER CONTROL DATA SYSTEM We also have another independent system for operational river inflow forecasts, but not finished yet Hydro-meteorological Information System of the Drina river basin HIS of the Danube river basin is being planned. As we use several meteorological models, we want to use at least two independent sources of inflow forecast (hydro-meteorological models). In any case, we need more and more meteorological input data, and of course, more and more accurate forecasts. Head Department for Electricity Trade 15
Head Department for Electricity Trade USER SUGGESTIONS: Normal period should be 1981-2010for practical purposes, the period 1961-1990 or 1971-2000 does not fully comply with our applications We would be glad if SEECOF discussed and adopted more month by month seasonal forecast and also by weeks or decades if it would be possiblein the future. (for the first month it is possible) We would also be glad if SEECOF begin to use exactly values in the future to express forecast by months (instead of “little above normal”: “+1.2 C” or “from +0.4 C to +2.0 C” like we saw in Hungary presentation) For all of our activities in the planning, we need more accurate forecasts and for a longer period. It is your mission. THANK YOU !