Download
1 / 10
110 likes | 193 Vues
The IoT in oil and gas market ecosystem comprises established oil and gas original equipment manufacturers (OEMs), technology vendors, and solutions and services providers. The rising interestin Internet of Things (IoT) amongst the companies, such as Cisco Systems, GE Digital, Microsoft Corporation and IBM, has been a major trend in the market. The IoT in oil and gas market comprises major companies providing solutions, platform, automation system and others.

E N D
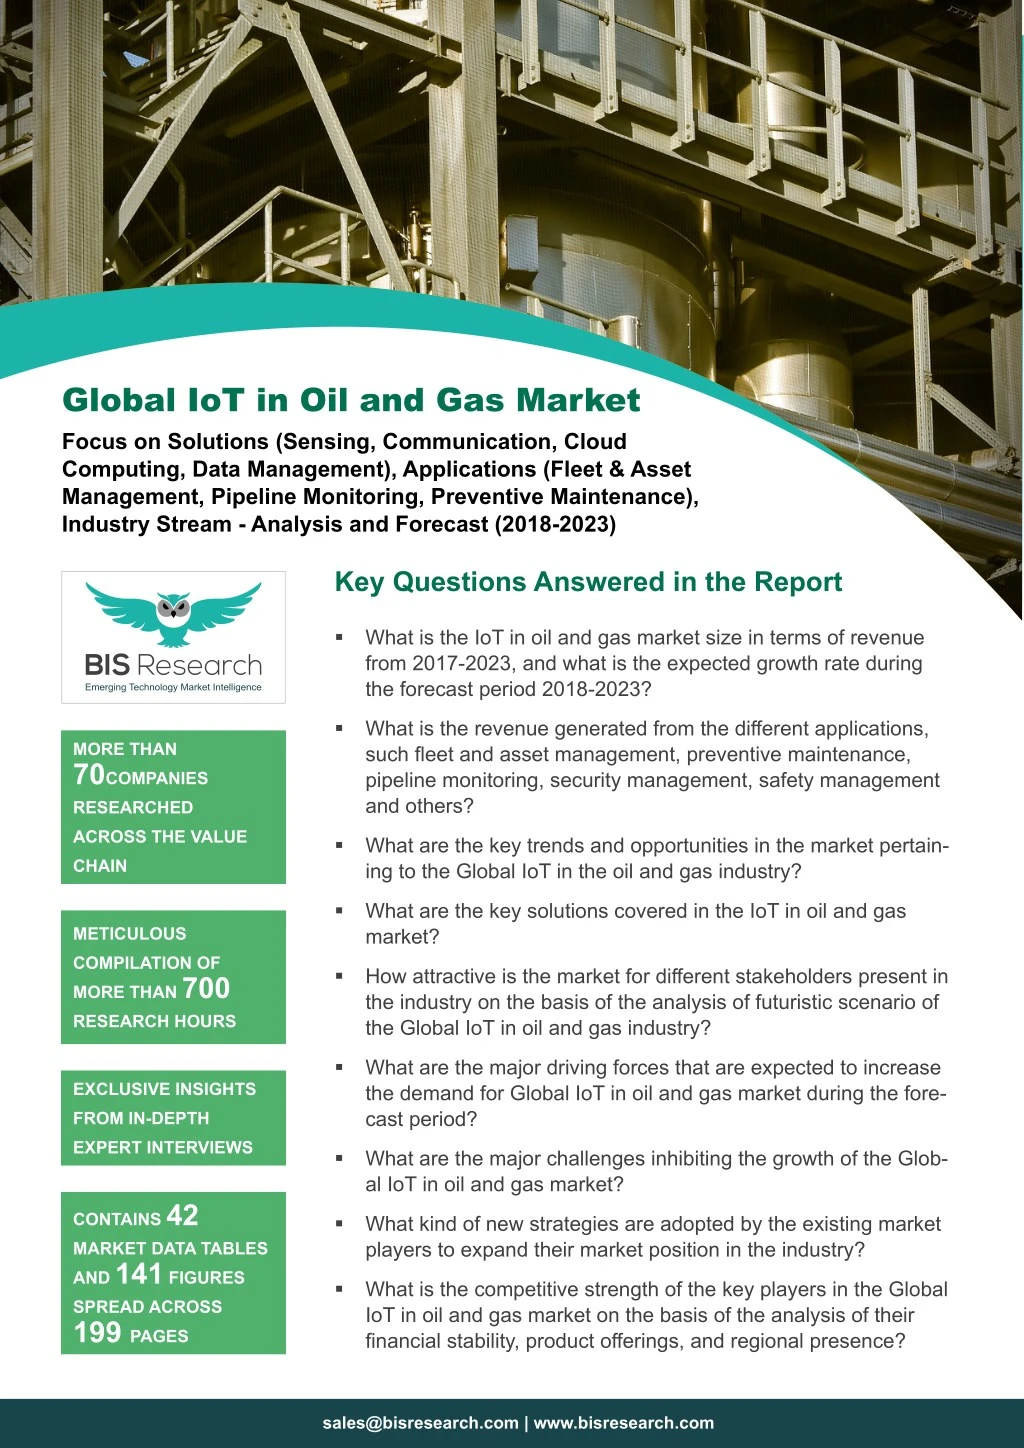
Global IoT in Oil and Gas Market Focus on Solutions (Sensing, Communication, Cloud Computing, Data Management), Applications (Fleet & Asset Management, Pipeline Monitoring, Preventive Maintenance), Industry Stream - Analysis and Forecast (2018-2023) Key Questions Answered in the Report What is the IoT in oil and gas market size in terms of revenue from 2017-2023, and what is the expected growth rate during the forecast period 2018-2023? What is the revenue generated from the different applications, such fleet and asset management, preventive maintenance, pipeline monitoring, security management, safety management and others? MORE THAN 70COMPANIES RESEARCHED ACROSS THE VALUE What are the key trends and opportunities in the market pertain- ing to the Global IoT in the oil and gas industry? CHAIN What are the key solutions covered in the IoT in oil and gas market? METICULOUS COMPILATION OF MORE THAN 700 RESEARCH HOURS How attractive is the market for different stakeholders present in the industry on the basis of the analysis of futuristic scenario of the Global IoT in oil and gas industry? What are the major driving forces that are expected to increase the demand for Global IoT in oil and gas market during the fore- cast period? EXCLUSIVE INSIGHTS FROM IN-DEPTH EXPERT INTERVIEWS What are the major challenges inhibiting the growth of the Glob- al IoT in oil and gas market? CONTAINS 42 MARKET DATA TABLES AND 141 FIGURES SPREAD ACROSS 199 PAGES What kind of new strategies are adopted by the existing market players to expand their market position in the industry? What is the competitive strength of the key players in the Global IoT in oil and gas market on the basis of the analysis of their financial stability, product offerings, and regional presence? sales@bisresearch.com | www.bisresearch.com
Table of Contents Market Drivers Market Restraints Market Opportunities SCOPE & RESEARCH METHODOLOGY Key Market Developments and Strategies Leading Player Analysis Report Scope IoT in Oil and Gas Market Research Methodology Industry Attractiveness Key Venture Capital Investments Emerging Trends in the IoT in Oil and Gas Market Opportunity Matrix Regulatory Bodies/Acts Associations/Consortiums/Alliances Privacy Laws Across Different Countries Patent Filed by Key Companies MARKET DYNAMICS COMPANY PROFILES COMPETITIVE INSIGHTS Cisco Systems C3 IoT International Business Machines Corporation (IBM) INDUSTRY ANALYSIS GLOBAL IOT IN OIL AND GAS MARKET, (BY INDUSTRY STREAM) Assumptions and Limitations for Analysis and Forecast of the Global IoT in Oil and Gas Market Upstream Midstream Downstream Intel Corporation Microsoft Corporation GLOBAL IOT IN OIL AND GAS MARKET, (BY SOLUTIONS) Telit ABB Ltd. GLOBAL IOT IN OIL AND GAS MARKET, (BY APPLICATION) General Electric Sensing Systems Communication Cloud and Edge Computing Data Management Honeywell International Inc. GLOBAL IOT OIL AND GAS MARKET (BY REGION) Schneider Electric Siemens AG Fleet and Asset Management Preventive Maintenance Pipeline Monitoring Security Management Others Equinor Rockwell Automation Inc. Royal Dutch Shell Schlumberger North America Europe Asia-Pacific Rest of the world (RoW) VIEW COMPLETE TABLE OF CONTENT sales@bisresearch.com | www.bisresearch.com
List of Tables 1. Market Snapshot: Global IoT in Oil and Gas Market 26. RoW IoT in Oil and Gas Market (by Industry Stream), 2017-2023 2. Analyzing Threat of New Entrants 27. RoW IoT in Oil and Gas Market (by Country), 2017-2023 3. Analyzing Bargaining Power of Buyers 4. Analyzing Bargaining Power of Suppliers 28. Cisco Systems: Product Portfolio 5. Analyzing the Threat from Substitute 29. C3IoT: Product Portfolio 6. Analyzing the Intensity of Competitive Rivalry 30. IBM Corporation: Product Portfolio 7. Regulatory Bodies/Act in Global IoT in Oil and Gas Market 31. Intel Corporation: Product Portfolio 32. Microsoft Corporation: Product Portfolio 8. Associations/Consortiums in Global IoT in Oil and Gas Market 33. Telit : Product Portfolio 9. Privacy Laws followed by different Countries in Global IoT in Oil and Gas Market 34. ABB Ltd.: Product Portfolio 35. General Electric: Product Portfolio 10. Some of the Recently Filed Patent 36. Honeywell International: Product Portfolio 11. Global IoT in Oil and Gas Market (by Industry Stream), 2017-2023, ($Billion) 37. Schneider Electric: Product Portfolio 38. Siemens AG: Product Portfolio 12. Global IoT in Oil and Gas Market (by Solutions), 2017-2023 ($Billion) 39. Equinor: Product Portfolio 13. Global IoT in Oil and Gas Market (by Application), 2017-2023 ($Billion) 40. Rockwell Automation Inc.: Product Portfolio 41. Royal Dutch Shell: Product PortfolioTable 14. Global IoT in Oil and Gas Market (by Region), 2017-2023 42. Schlumberger: Product Portfolio 15. Recent Developments in the North American IoT in Oil and Gas Industry 16. North America IoT in Oil and Gas Market (by Application), 2017-2023 17. North America IoT in Oil and Gas Market (by Industry Stream), 2017-2023 18. North America IoT in Oil and Gas Market (by Country), 2017-2023 19. Europe IoT in Oil and Gas Market (by Application), 2017-2023 20. Europe IoT in Oil and Gas Market (by Industry Stream), 2017-2023 21. Europe IoT in Oil and Gas Market (by Country), 2017-2023 22. Asia-Pacific IoT in Oil and Gas Market (by Application), 2017-2023 23. Asia-Pacific IoT in Oil and Gas Market (by Industry Stream), 2017-2023 24. Asia-Pacific IoT in Oil and Gas Market (by Country), 2017-20233 25. RoW IoT in Oil and Gas Market (by Application), 2017-2023 sales@bisresearch.com | www.bisresearch.com
List of Figures 1. Global IoT in Oil and Gas Market Snapshot 26. IoT in Oil and Gas: By Solutions 2. Global IoT in Oil and Gas Market (by Solutions), 2018 and 2023 27. Global IoT in Oil and Gas Market (by Solutions) 28. Sensing Systems in IoT in Oil and Gas Market, 2017-2023 3. Global IoT in Oil and Gas Market (by Application), $Billion, 2018 and 2023 29. Wireless Sensors: Application 4. Global IoT in Oil and Gas Market (by Industry Stream), 2018-2023 30. Communication Systems in IoT in Oil and Gas Market, 2017-2023 5. Global IoT in Oil and Gas Market (by Region), 2018-2023 31. Cloud and Edge Computing Systems in IoT in Oil and Gas Market, 2017-2023 6. Global IoT in Oil and Gas Market (by Country), 2017 32. Data Management Systems in IoT in Oil and Gas Market, 2017-2023 7. Market Dynamics 8. Impact Analysis of Drivers 33. IoT in Oil and Gas: By Application 9. U.S. Oil and Gas Industry Workforce: Facts 34. Fleet and Asset Management in IoT in Oil and Gas Market, 2017-2023 10. Impact Analysis of Restraints 35. Preventive Maintenance in IoT in Oil and Gas Market, 2017-2023 11. Strategies Adopted by the Key Players (June 2015-November 2018 36. Pipeline Monitoring in IoT in Oil and Gas Market, 2017-2023 12. Share of Key Market Strategies and Developments (June2015- November 2018) 37. Increasing Number of Cyber- Crime Incidents in the U.S. 13. Partnerships, Collaborations and Joint Venture Shares (by Companies) 38. Security Management in IoT in Oil and Gas Market, 2017-2023 14. New Product Launches and Development Share (by Companies) 39. Others in IoT in Oil and Gas Market, 2017-2023 15. Business Expansion and Contract Share (by Companies) 40. Global IoT in Oil and Gas Regional Market Share and Growth Rate, 2018-2023 16. Merger and Acquisition Share (by Companies) 41. North America IoT in Oil and Gas Market, 2017-2023 17. Leading Player Analysis of IoT Solution Providers in IoT in Oil and Gas Market 42. North America IoT in Oil and Gas Market (by Application) 18. Leading Player Analysis of Automation and Power Management Companies in IoT in Oil and Gas Market 43. North America IoT in Oil and Gas Market (by Industry Stream) 19. Leading Player Analysis of Oil and Gas Companies in IoT in Oil and Gas Market 44. North America IoT in Oil and Gas Market (by Country) 45. The U.S. IoT in Oil and Gas Market, 2017- 2023 20. Porter’s Five Forces Analysis for the IoT in Oil and Gas Market 46. Canada IoT in Oil and Gas Market, 2017-2023 21. Global IoT in Oil and Gas Market Opportunity Matrix, (by Region), 2018 and 2023 47. Mexico IoT in Oil and Gas Market, 2017-2023 22. Global IoT in Oil and Gas Market (by Industry Stream) 48. Europe IoT in Oil and Gas Market, 2017-2023 49. Europe IoT in Oil and Gas Market (by Application 23. Upstream Segment in IoT in Oil and Gas Market, 2017-2023 50. Europe IoT in Oil and Gas Market (by Industry Stream) 24. Midstream Segment in IoT in Oil and Gas Market, 2017-2023 51. Europe IoT in Oil and Gas Market (by Country) 25. Downstream Segment in IoT in Oil and Gas Market, 2017-2023 52. The U.K. IoT in Oil and Gas Market, 2017-2023 sales@bisresearch.com | www.bisresearch.com
List of Figures 53. Norway IoT in Oil and Gas Market, 2017-2023 85. IBM Corporation: Overall Financials, 2015-2017 54. The Netherlands IoT in Oil and Gas Market, 86. IBM Corporation: Net Revenue by Business Segment, 2015-2017 55. 2017-2023 56. France IoT in Oil and Gas Market, 2017-2023 87. IBM Corporation: Net Revenue by Regional Segment, 2015-2017 57. Germany IoT in Oil and Gas Market, 2017-2023 58. Denmark IoT in Oil and Gas Market, 2017-2023 88. IBM Corporation: SWOT Analysis 89. Intel Corporation: Overall Financials, 2015-2017 59. Rest of Europe IoT in Oil and Gas Market, 2017-2023 90. Intel Corporation: Net Revenue by Business Segment, 2015-2017 60. Asia-Pacific IoT in Oil and Gas Market, 2017-2023 61. Asia-Pacific IoT in Oil and Gas Market (by Application) 91. Intel Corporation: Net Revenue by Regional Segment, 2015-2017 62. Asia-Pacific IoT in Oil and Gas Market (by Industry Stream) 92. Intel Corporation: SWOT Analysis 93. Microsoft Corporation: Overall Financials, 2016-2018 63. Asia-Pacific IoT in Oil and Gas Market (by Country) 94. Microsoft Corporation: Net Revenue by Business Segment, 2016-2018 64. China IoT in Oil and Gas Market, 2017-2023 65. Japan IoT in Oil and Gas Market, 2017-2023 95. Microsoft Corporation: Net Revenue by Regional Segment, 2016-2018 66. South Korea IoT in Oil and Gas Market, 2017-2023 96. Microsoft Corporation: SWOT Analysis 67. India IoT in Oil and Gas Market, 2017-2023 97. Telit: Overall Financials, 2015-2017 68. Malaysia IoT in Oil and Gas Market, 2017-2023 98. Telit: Net Revenue by Business Segment, 2015-2017 69. Vietnam IoT in Oil and Gas Market, 2017-2023 99. Telit: Net Revenue by Regional Segment, 2015-2017 70. Figure 7.30: Rest of Asia-Pacific IoT in Oil and Gas Market, 2017-2023 100. Telit: SWOT Analysis 71. RoW IoT in Oil and Gas Market, 2017-2023 101. ABB Ltd.: Overall Financials, 2015-2017 72. RoW IoT in Oil and Gas Market (by Application) 102. ABB Ltd.: Net Revenue by Business Segment, 2015-2017 73. RoW IoT in Oil and Gas Market (by Industry Stream) 103. ABB Ltd.: Net Revenue by Regional Segment, 2015-2017 74. RoW IoT in Oil and Gas Market (by Country) 75. Brazil IoT in Oil and Gas Market, 2017-2023 104. ABB Ltd.: SWOT Analysis 76. Figure 7.36 Saudi Arabia IoT in Oil and Gas Market, 2017-2023 105. General Electric: Overall Financials, 2015-2017 106. General Electric: Net Revenue by Business Segment, 2015-2017 77. UAE IoT in Oil and Gas Market, 2017-2023 78. Others IoT in Oil and Gas Market, 2017-2023 107. General Electric: Net Revenue by Regional Segment, 2015-2017 79. Segmentation of Key Companies Profiled 80. Cisco Systems: Overall Financials, 2015-2017 108. General Electric: SWOT Analysis 81. Cisco Systems: Net Revenue (by Region), 2015-2017 109. Honeywell International: Overall Financials, 2015- 2017 82. Cisco Systems: Net Revenue by Business Segment, 2015-2017 110. Honeywell International: Net Revenue by Business Segment, 2015-201 83. Cisco Systems: SWOT Analysis 111. Honeywell International: Net Revenue by Regional Segment, 2015-2017 84. C3 IoT: SWOT Analysis 112. Honeywell International: SWOT Analysis sales@bisresearch.com | www.bisresearch.com
List of Figures 113. Schneider Electric: Overall Financials, 2015-2017 114. Schneider Electric: Net Revenue by Business Segment, 2015-2017 115. Schneider Electric: Net Revenue by Regional Segment, 2015-2017 116. Schneider Electric: SWOT Analysis 117. Siemens AG: Overall Financials, 2015-2017 118. Siemens AG: Net Revenue by Business Segment, 2015-2017 119. Siemens AG: Net Revenue by Regional Segment, 2015-2017 120. Siemens AG: SWOT Analysis 121. Equinor: Overall Financials, 2015-2017 122. Equinor: Net Revenue by Business Segment, 2015-2017 123. Equinor: SWOT Analysis 124. Rockwell Automation Inc.: Overall Financials, 2016-2018 125. Rockwell Automation Inc.: Net Revenue by Business Segment, 2016-2018 126. Rockwell Automation Inc.: Net Revenue by Regional Segment, 2015-2017 127. Rockwell Automation Inc.: SWOT Analysis 128. Royal Dutch Shell: Overall Financials, 2015-2017 129. Royal Dutch Shell: Net Revenue by Business Segment, 2015-2017 130. Royal Dutch Shell: Net Revenue by Regional Segment, 2015-2017 131. Royal Dutch Shell: SWOT Analysis 132. Schlumberger: Overall Financials, 2015-2017 133. Schlumberger: Net Revenue by Business Segment, 2015-2017 134. Schlumberger: Net Revenue by Regional Segment, 2015-2017 135. Schlumberger: SWOT Analysis 136. IoT in Oil and Gas Market Scope 137. Report Methodology 138. Primary Interviews Breakdown, by Player, Designation, and Country 139. Sources of Secondary Research 140. Data Triangulation 141. Top Down-Bottom-Up Approach for Market Estimation sales@bisresearch.com | www.bisresearch.com
Research Scope & BIS Methodology 1. Scope of the Report The report is a thorough study of the IoT in oil and gas market share and market size, including the analysis of solutions used and applications of IoT in the oil and gas industry. The market trends across the leading countries have also been extensively analyzed in the IoT in oil and gas market study. Further, the market estimated in different sections of the report considered “2018-2023” as the forecast period. Figure 1: Research Scope & BIS Methodology Global IoT in Oil and Gas Market Forecast Influencing Factors (Market Trends and Dynamics) Market Size Venture Capital Investments in the IoT in Oil and Gas Industry Industry Analysis Porter’s Five Forces Analysis Companies Key Developments Emerging Trends in the Oil and Gas Industry Market Drivers Market Restraints Market Opportunities Industry Trends Industry Analysis Leading Player Analysis Region Wise Market Market Size & Share Analysis High Growth Segments Market Size & Forecast: By Solution By Industry Stream By Application By Geography Compound Annual Growth Rate (CAGR) Global IoT in Agriculture Market Segmentation By Application By Solution By Industry Stream By Region Fleet and Asset Management Preventive Maintenance Pipeline Monitoring Security Management Safety Management Others Sensing Communication Cloud & Edge Computing Data Management Upstream Midstream Downstream North America Europe Asia-Pacific Rest-of-the World REQUEST FOR SAMPLE sales@bisresearch.com | www.bisresearch.com
Research Scope & BIS Methodology 2. IoT in Oil and Gas Market Research Methodology The research methodology design adopted for this specific study includes a combination of data collected from primary and secondary researches. Both the primary sources (in-house experts, industry leaders, market players, and independent consultants) and the secondary (a host of paid and unpaid databases) sources have been used along with analytical tools to build the forecast and predictive modes. Primary Data Sources The primary sources involve the industry experts from the IoT in oil and gas market including the related regulatory associations. In the extensive primary research process undertaken for this study, the primary sources further include industry experts and key executives from the prominent companies and organizations in the IoT in oil and gas sector. All such resources were interviewed to obtain and verify both the qualitative and the quantitative aspects of this research study The Key Data Points Taken From Primary Sources Include: Validation and triangulation of all the numbers and graphs Validation of report’s segment and key qualitative findings Understanding the competitive landscape Validation of several markets for the IoT systems Percentage split for countries Secondary Data Sources This research study involves the usage of extensive secondary sources, directories, company websites, annual reports and investor presentations. It also makes use of databases such as Hoovers, Bloomberg, Business-week, and Factiva to collect the useful information for an extensive, market-oriented, and commercial study of the regional market. Secondary research was done to obtain crucial information about the industry’s value chain, market’s monetary chain, total pool of key players, and the prevalent applications and systems in this sector. The key data points taken from secondary sources include: Segmentation breakups, split-ups, and percentage shares Data for market size Key industry trends of the top players of the market sales@bisresearch.com | www.bisresearch.com
Research Scope & BIS Methodology Data Triangulation The process of market engineering involves the calculation of the market statistics, market size estimation, market forecast, market crackdown, and data triangulation (the methodology for these quantitative data processes is explained in the further sections). An extensive primary research study was undertaken to gather information, and authenticate the critical numbers derived through the segmentation types, industry trends, and key players of each type of sensors in the market. Figure 2: Data Triangulation BIS Research Internal Repository Key Players Competitive Landscape Opportunities/Challenges Market Size and Market Share (2018-2023) Market Estimates Regional Analysis Bis Research Internal Repository DATA TRIANGULATION Primary Sources Secondary Sources Primary Sources Secondary Sources Interview With: Annual reports of key industrial players SEC Filings 10K reports Investor Presentations Journals Press Releases Paid & Unpaid Databases International Energy Association U.S. Energy Association OEMs Oil and Gas Consultants IoT Solutions Manufacturers IoT consultants Distributors Oil and Gas Key Players sales@bisresearch.com | www.bisresearch.com
BIS Research 39111 Paseo Padre PKWY STE 313, Fremont CA 94538-1686, Tel: +1-510-404-8135 Global Delivery Centre Tapasya Corp Heights, Subarea, Sector 126, Noida, NCR-201303 India Tel: +91 120 4261540 / +91 120 4261544 To know more about us, please visit our website: bisresearch.com For other queries contact: sales@bisresearch.com sales@bisresearch.com | www.bisresearch.com sales@bisresearch.com | www.bisresearch.com