Download
1 / 1
10 likes | 213 Vues
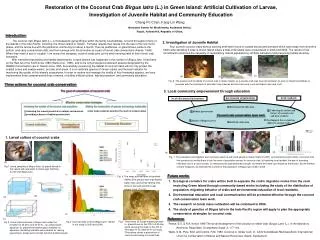
Simulation of Time Series Deformation Analysis for Verifying a Refined Small BAseline Subset (SBAS) Technique. Chang-Wook Lee (1) , Zhong Lu (2) and Hyung-Sup Jung (3). SBAS result.

E N D
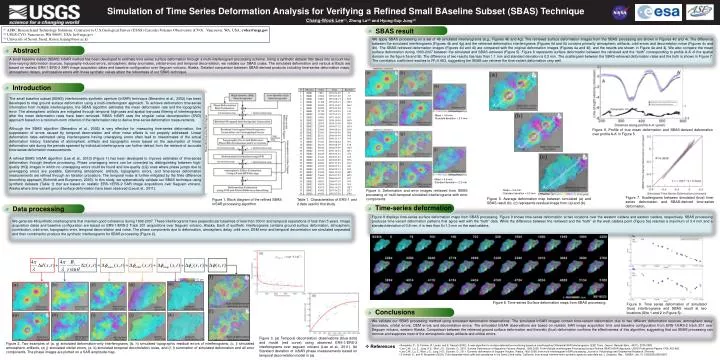
Simulation of Time Series Deformation Analysis for Verifying a Refined Small BAseline Subset (SBAS) Technique Chang-Wook Lee(1), Zhong Lu(2) and Hyung-Sup Jung(3) SBAS result (1) ASRC Research and Technology Solutions, Contractor to U.S.Geological Survey (USGS) Cascades Volcano Observatory (CVO), Vancouver, WA, USA; cwlee@usgs.gov (2) USGS CVO, Vancouver, WA 98683, USA; lu@usgs.gov (3) University of Seoul, Seoul, Korea; hsjung@uos.ac.kr We apply SBAS processing on a set of 48 simulated interferograms (e.g., Figures 4b and 4g). The retrieved surface deformation images from the SBAS processing are shown in Figures 4d and 4i. The difference between the simulated interferograms (Figures 4b and 4g) and the retrieved deformation interferograms (Figures 4d and 4i) contains primarily atmospheric artifacts, orbit errors and decorrelation noise (Figures 4c and 4h). The SBAS-retrieved deformation images (Figures 4d and 4i) are compared with the original deformation images (Figures 4a and 4f), and the results are shown in Figure 4e and 4j. We also compare the mean surface deformation during 1993-2007 between the simulated and SBAS-retrieved (Figure 5). Figure 6 represents surface deformation between the retrieved and the “truth” corresponding to profile A-A’ of the spatial domain on the figure 5a and 5b. The difference of two results has less than 1.1 mm and standard deviation is 0.2 mm. The scattergram between the SBAS-retrieved deformation rates and the truth is shown in Figure 7. The correlation coefficient reaches to R2=0.963, suggesting the SBAS can retrieve the time-variant deformation very well. Abstract A small baseline subset (SBAS) InSAR method has been developed to estimate time series surface deformation through a mutli-interferogram processing scheme. Using a synthetic dataset that takes into account two time-varying deformation sources, topography-induced errors, atmospheric delay anomalies, orbital errors and temporal decorrelation, we validate our SBAS codes. The simulated deformation and various artifacts are based on realistic ERS-1/ERS-2 SAR image acquisition dates and baseline configuration over Seguam volcano, Alaska. Detailed comparison between SBAS-derived products including time-series deformation maps, atmospheric delays, and baseline errors with those synthetic values attest the robustness of our SBAS technique. Introduction The small baseline subset (SBAS) interferometric synthetic aperture (InSAR) technique (Berardino et al., 2002) has been developed to map ground surface deformation using a multi-interferogram approach. To achieve deformation time-series information from multiple interferograms, the SBAS algorithm estimates the mean deformation rate and the topographic error. The atmospheric artifacts are mitigated through temporal high-pass and spatial low-pass filtering of interferograms after the mean deformation rates have been removed. SBAS InSAR uses the singular value decomposition (SVD) approach based on a minimum-norm criterion of the deformation rate to derive time-series deformation measurements. Although the SBAS algorithm (Berardino et al., 2002) is very effective for measuring time-series deformation, the suppression of errors caused by temporal decorrelation and other noise effects is not properly addressed. Linear deformation rates estimated using interferograms having unwrapping errors often lead to misestimates of the actual deformation history. Estimates of atmospheric artifacts and topographic errors based on the assumption of linear deformation rate during the periods spanned by individual interferograms can further detract from the retrieval of accurate time-series deformation measurements. A refined SBAS InSAR algorithm (Lee et al., 2010) (Figure 1) has been developed to improve estimates of time-series deformation through iterative processing. Phase unwrapping errors can be corrected by distinguishing between high-quality (HQ) images in which no unwrapping errors could be found and low-quality (LQ) ones where phase jumps due to unwrapping errors are possible. Estimating atmospheric artifacts, topographic errors, and time-series deformation measurements are refined through an iteration procedure. The temporal noise is further mitigated by the finite difference smoothing approach (Schmidt and Burgmann, 2003). In this study, we systematically validate our SBAS technique using synthetic datasets (Table 1) that are based on realistic ERS-1/ERS-2 SAR image acquisitions over Seguam volcano, Alaska where time-variant ground surface deformation have been observed (Lee et al., 2011). - Mean = 0.6 mm - Standard deviation = 2.4 mm Figure 6. Profile of true mean deformation and SBAS-derived deformation over profile A-A’ in Figure 5. - Mean = 0.6 mm - Standard deviation = 2.2 mm Figure 4. Deformation and error images retrieved from SBAS processing of multi-temporal simulated interferograms with error components. - Mean = 0.6 mm - Standard deviation = 0.2 mm Figure 7. Scattergrams between simulated (true) time-series deformation and SBAS-derived time-series deformation. Figure 5. Average deformation map betweensimulated (a) and SBAS result (b). (c) represents residual image from (a) and (b). Figure 1. Block diagram of the refined SBAS InSAR processing algorithm Table 1. Characteristics of ERS-1 and 2 data used in this study Time-series deformation Data processing Figure 8 displays time-series surface deformation maps from SBAS processing. Figure 9 shows time-series deformation at two locations over the western caldera and eastern caldera, respectively. SBAS processing produces time-variant deformation patterns that agree well with the “truth” data. While the difference between the retrieved and the “truth” at the west caldera point (Figure 5a) reaches a maximum of 3.4 mm and a standard deviation of 0.8 mm, it is less than 6±1.3 mm on the east caldera. We generate 48 synthetic interferograms that maintain good coherence during 1992-2007. These interferograms have perpendicular baselines of less than 300 m and temporal separations of less than 5 years. Image acquisition dates and baseline configuration are based on ERS-1/ERS-2 Track 201 acquisitions over Seguam volcano, Alaska. Each of synthetic interferograms contains ground surface deformation, atmospheric contribution, orbit error, topographic error, temporal decorrelation and noise. The phase components due to deformation, atmospheric delay, orbit error, DEM error and temporal decorrelation are simulated separated and then combined to produce the synthetic interferograms for SBAS processing (Figure 2). 0 1.5 cm Figure 8. Time-series Surface deformation maps from SBAS processing. Figure 9. Time series deformation of simulated (true) interferograms and SBAS result at two locations (Site 1 and 2 in Figure 5). Conclusions We validate our SBAS processing method using simulated deformation observations. The simulated InSAR images contain time-variant deformation due to two different deformation sources, atmospheric delay anomalies, orbital errors, DEM errors and decorrelation errors. The simulated InSAR observations are based on realistic SAR image acquisition time and baseline configuration from ERS-1/ERS-2 track 201 over Seguam volcano, western Alaska. Comparison between the retrieved ground surface deformation and theoretic (true) deformation confirms the effectiveness of this algorithm, suggesting that our SBAS processing can remove and suppress most of the atmospheric delay artifacts and orbital errors. Figure 3. (a) Temporal decorrelation observations (blue dots) and model (red curve) using observed ERS-1/ERS-2 interferograms over seguam volcano (Lee et al., 2011). (b) Standard deviation of InSAR phase measurements based on temporal decorrelation model in (a). Figure 2. Two examples of (a, g) simulated deformation-only interferograms, (b, h) simulated topographic residual errors of interferograms, (c, i) simulated atmospheric artifacts, (d, j) simulated orbital errors, (e, k) simulated temporal decorrelation noise, and (f, l) summation of simulated deformation and all error components. The phase images are plotted on a SAR amplitude map. • References • Berardino, P., G. Fornaro, R. Lanari, and E. Sansoti (2002), A new algorithm for surface deformation monitoring based on small baseline Differential SAR Interferograms, IEEE Trans. Geosci. Remote Sens., 40(11), 2375-2383. • Lee C.W., Lu, Z., Jung, H.S., Won, J.S., Dzurisin, D., 2010. Surface Deformation of Augustine Volcano (Alaska), 1992-2005, From Multiple-Interferogram Processing Using a Refined SBAS InSAR Approach, USGS Professional Papers 1769, 453-465. • Lee C.W., Lu, Z., Won, J.S., Jung, H.S., Dzurisin, D., 2011. Dynamic deformation of Seguam Volcano, Alaska, 1992-2008, from multi-interferogram InSAR processing, Journal of Volcanology and Geothermal Research, (Review). • Schmidt, D., and R. Burgmann (2003), Time-dependent land uplift and subsidence in the Santa Clara valley, California, from a large interferometric synthetic aperture radar data set, J. Geophys. Res., 108(B9) , doi: 10.1029/2002JB002267.