Download
1 / 29
290 likes | 470 Vues
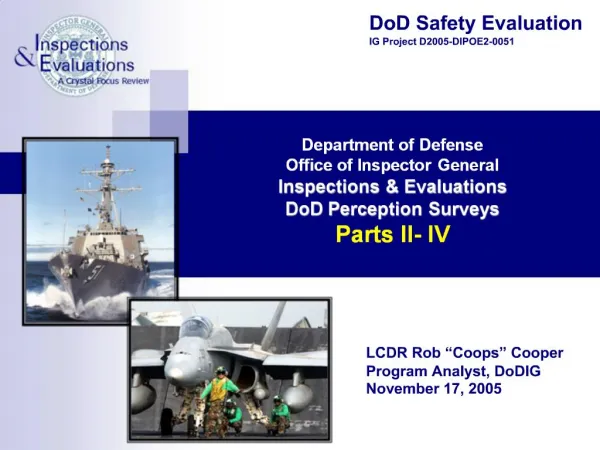
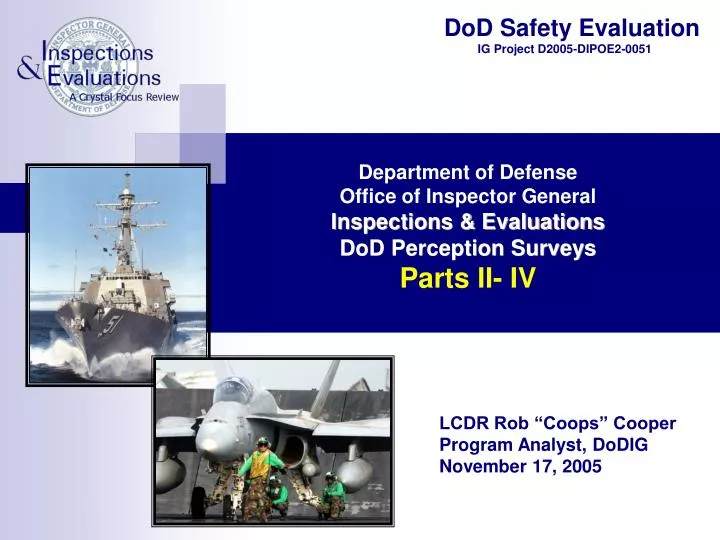
DoD Safety Evaluation IG Project D2005-DIPOE2-0051. Department of Defense Office of Inspector General Inspections & Evaluations DoD Perception Surveys Parts II- IV. LCDR Rob “Coops” Cooper Program Analyst, DoDIG November 17, 2005. Agenda. Safety Evaluation Background

E N D
DoD Safety Evaluation IG Project D2005-DIPOE2-0051 Department of Defense Office of Inspector General Inspections & Evaluations DoD Perception SurveysParts II- IV • LCDR Rob “Coops” Cooper • Program Analyst, DoDIG • November 17, 2005
Agenda • Safety Evaluation Background • Safety Project Objectives • Perception Survey • Take Aways
Evaluation Background SecDef’s Challenge Honorable Donald Rumsfeld Secretary of Defense “World class organizations do not tolerate preventable accidents.”
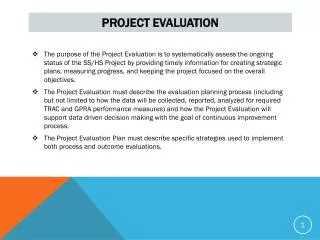
Evaluation Background DoD IG Announcement • The purpose of our project is to: • Evaluate the DOD safety program and suggest changes to help achieve a reduction in accidents, as directed by the Secretary of Defense. • Identify safety issues within DoD and provide a roadmap for change to improve the Department’s safety program.
Evaluation Background Project Outline Project Elements: • Policy • Organization • PPBE • Exceptional Practices • Safety Perception Survey • Part I - Senior Leader • Part II - Active Duty • Part III - Civilian • Part IV - Guard/Reserve
Balancing Assessments • Lagging • Aircraft Mishaps • Fatality Rates • Lost Work-Day Rates • Motor Vehicle Accidents • Workers Compensation • Leading • PerceptionSurveys • Behavior Observations • Internal/External Reviews • Near-Miss Data • Process Measures Consequence Prevention
Safety Program Transformation Prevention Programs Consequence Management LEADING INDICATORS LAGGING INDICATORS Aircraft Mishaps Near-miss Data INCIDENT Perception Surveys Motor Vehicle Accidents Overlap / Synergy? Process Measures Fatality Rates Mishap Prevention
Perception Survey Partnering • Survey developed and evaluated with the National Safety Council (NSC) • Reviewed by the Defense Manpower Data Center (DMDC) • External review by a National Safety Expert • OIG Quantitative Methods Division (QMD) independently reviewed to validate data
Perception Survey Purpose • Identify problem areas • Prioritize potential target components… that would lead to the mandated 50% reduction Objectives • Snapshot of today’s perception of safety within DoD • Provide comparative analysis (NSC Database) • Establish Baseline for the future • Motivate & Facilitate Leadership Involvement
Safety Perception Surveys Demographics 9,604 Active Duty (37% Response Rate) 46,171 Civilian Personnel (63%) 75,000+ Guard and Reserve (36%) 131,000+ Total Reponses Safety Barometer Survey • 46 Questions fromNational Safety Council (NSC) • 5-point scale • Benchmarked against NSC’s database (232 organizations) • Percentile (0 to 100th)
Survey Results Active Duty, Civilian, Guard/Reserve Active Guard/ Definition Title Duty Civilian Reserve The presence or quality of safety program practices – focus on communications, training, inspection, maintenance, and emergency response. Considers six primary roles supervisors use to communicate support: leader, manager, controller, trainer, worker advocate, organization representative. Describes ways top and middle management demonstrate leadership and commitment to safety through words, actions, organization, and control. Personnel general beliefs and impressions concerning leadership’s commitment and underlying philosophy regarding safety. Selected actions and reactions that are critical to making the program work – emphasis on personal responsibility and compliance. Safety Support Climate Supervisor Participation Leadership Participation Safety Support Activities Personnel Participation OVERALL Elements Requiring Attention
Survey Results Active Duty, Civilian, Guard/Reserve • Supports the validation of the survey data • Active Duty - 55th • Civilian personnel 56th • Guard & Reserve - 57th • There was no notable difference between the perceptions of the Active Duty, Civilian, and Guard/Reserve populations • Unit Teamwork is consistently high throughout • the DoD
Survey Results Active Duty, Civilian, Guard/Reserve Service perceptions concerning their safety climates are substantially different Safety is not uniformly established and accepted among ranks / grades – there is a substantial disconnect between senior management and the workforce Leadership and Personnel participation categories are perceived as the least positive
Survey Results Active Duty, Civilian, Guard/Reserve The elevated neutral response rate of 72% may indicate that the majority of components are not sufficiently visible The Active Duty force perceives that the stress from increased operations tempo contributes to increasing off-duty accidents
Active Duty Civilian Reserve 26 22 19 18 17 16 10 6 4 Benchmarked 46 Questions - Navy Overall • 15% scored above the 75th percentile • 41% scored in the 50th to 74th percentile • 44% scored below the 50th percentile
Customized Items- Navy 4 Questions Where Average Response Scored - Not Benchmarked
Safety perception is not uniform across all Grades Trend is normally less positive than seniors Substantial split between officers and enlisted Warrant Officers are uncharacteristically high Civilian Flightline is opposite the normal trend 36% Lower than Active Duty 46% Lower than Reserve Stress and Operational tempo is perceived as increasing off-duty accidents Observations
Take Aways… Questions for Reflection and Discussion: • How do we increase ownership in readiness/safety amongst all Navy personnel? • How do we describe the desired end-state? • How do you align policy and program resources with the strategic goal of mishap reduction? • What are the leading indicators that will impact mishap prevention and program effectiveness?
DoD Safety Evaluation IG Project D2005-DIPOE2-0051 “World class organizations do not tolerate preventable accidents.” Honorable Donald Rumsfeld
Points of Contact Division Chief – Col Forrest Sprester forrest.sprester@dodig.mil Team Leader – Mr Mike Herbaugh michael.herbaugh@dodig.mil Organization – Dr Sardar Hassan sardar.hassan@dodig.mil Policy – Mr Kayode Bamgbade kayode.bamgbade@dodig.mil PPBE – Mrs Susann Stephenson susann.stephenson@dodig.mil Surveys – Lt Col Heidie Rothschild heidie.rothschild@dodig.mil – LCDR Rob Cooper robert.cooper@dodig.mil Federal Advisory Commission & Technical Support – Ms Carol Brink-Meissner cbrink-meissner@dodig.mil http://www.dodig.osd.mil/Inspections/IE/safetyproject.html