Download
1 / 36
360 likes | 476 Vues
CMB Observations with the Cosmic Background Imager. Tim Pearson for the CBI team. Tony Readhead (Principal Investigator), Steve Padin (Project Scientist until 2002). CBI Timeline. 1995-1999: design and construction 1998-1999: testing in Pasadena 1999: ship to Chile and commission

E N D
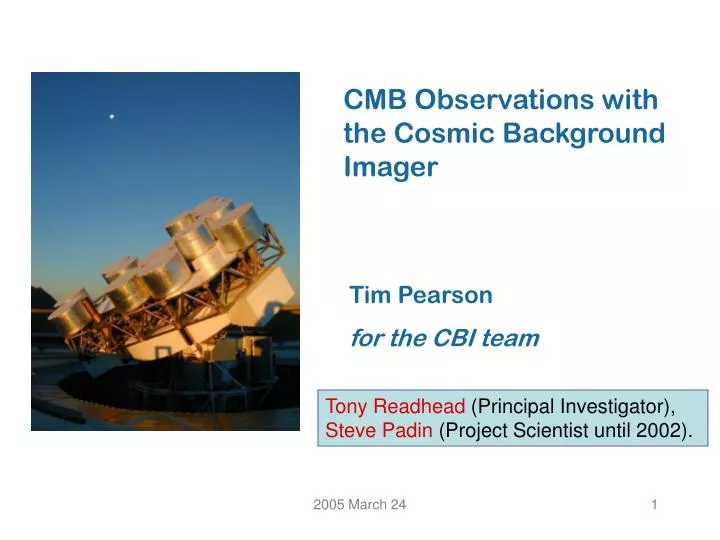
CMB Observations with the Cosmic Background Imager Tim Pearson for the CBI team Tony Readhead (Principal Investigator), Steve Padin (Project Scientist until 2002). 2005 March 24
CBI Timeline • 1995-1999: design and construction • 1998-1999: testing in Pasadena • 1999: ship to Chile and commission • 2000-2001: CMB T and SZE observations (Stokes L) • 2-field differencing • 2002-2005: CMB polarization observations (Stokes L&R) • 6-field common mode • Jun 2005 - present: idle (unfunded) • May-Dec 2006: upgrade to larger antennas, T/SZE observations • 2007- : replace with QUIET receivers 2005 March 24
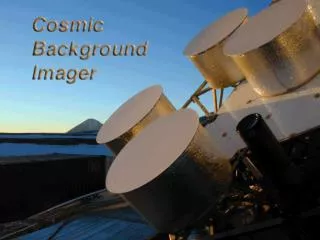
13 Cassegrain antennas 0.9 m diameter 26–36 GHz, 10 channels HEMT amplifiers, Tsys ~ 27 K Baselines 1 m – 5.5 m Analog correlator Alt-az mount with parallactic rotation 2005 March 24
An interferometer cross-correlates the signals received by two separated antennas: the response (“visibility”) is proportional to a Fourier component with spatial frequency u = d/λ. The power spectrum Cl is the expectation of the square of the Fourier transform of the sky intensity distribution: i.e., closely related to the square of the visibilityVV*. Multipole l = 2p u Estimate spectrum by squaring visibility and subtracting noise bias. The observed sky is multiplied by the primary beam, corresponding to convolution (smoothing) in the (u,v) plane: so the interferometer measures a smoothed version of the power spectrum. Mosaicing several fields is equivalent to using a larger primary beam, thus improving resolution in l. CMB interferometers CAT, DASI, CBI, VSA, MINT, Amiba The CBI – Interferometry of the CMB 2005 March 24
Interferometry Advantages • Insensitive to large-scale structure • Uncorrelated noise • Direct measurement of polarization Q ± iU • Beam uncertainty not very important • Very different systematics 2005 March 24
Chajnantor Observatory Home of CBI, QUIET, and other experiments 2005 March 24
Total Intensity Observations • Observations made in 1999-2002 • Problem 1: Ground spillover • Differencing of two fields observed at same AZ/EL • Problem 2: Foreground point sources • Measure with higher resolution instrument • “Project out” of dataset sources of known position • Statistical correction to power spectrum 2005 March 24
Mosaic images • Emission from ground (horizon) dominant on 1-meter baselines • Observe 2 fields separated by 8 min of RA, lead for 8 min followed by trail for 8 min; subtract corresponding visibilities. Ground emission cancels. • Images show lead field minus trail field • Also eliminates low-level spurious signals 2005 March 24
CBI Polarization • Compact array • switchable RCP or LCP 36 RR or LL baselines measure I 42 RL or LR baselines measure Q+iU or E+iB • New ground strategy: strips of 6 fields, remove common mode (mean);(Lose 1 mode per strip to ground) • CBI observes 4 patches of sky – 3 mosaics & 1 deep strip Pointings in each area separated by 45’. Mosaic 6x6 pointings, for 4.5deg square, deep strip 6x1. • 2.5 years of data, Aug 02 – Apr 05. * Note bug in earlier analysis: omitted one antenna (12/78 baselines!) 2005 March 24
Raw Images 2005 March 24
“Ground subtracted” images 2005 March 24
Data Reduction • Editing and calibration • Noise estimation • Gridding of RR+LL, RL, LR or T, E, and B with full covariance matrix calculation • Project out common ground (downweight linear combination of data) • Project out point sources in T • Ignore point sources in polarization • Images of E and B (FT of gridded estimators) • Power spectrum estimation by max likelihood 2005 March 24
2.9σ above model 2005 March 24
Projecting Out Variable Sources Marginalize over 1 parameter (flux) for each source, Or 2 parameters (2000-01 and 2002-05 flux). 2005 March 24
Cosmology Results CBI has measured power spectrum to much higher l than previous experiments, well into damping tail Flat universe with scale-invariant primordial fluctuation spectrum Low matter density, baryon density consistent with BBN, non-zero cosmological constant Agreement with Boomerang, DASI, VSA and Maxima at l < 1000 is excellent 2005 March 24
At 2000 < l <3500, CBI finds power ~ 3 sigma above the standard models • Not consistent with any likely model of discrete source contamination • Suggestive of secondary anisotropies, especially the SZ effect • Comparison with predictions from hydrodynamical calculations: strong • dependence on amplitude of density fluctuations, s87 . Requires s8~1.0 2005 March 24
Varying 6 parameters plus amplitude of SZ template component 2005 March 24
CBI Upgrade • Larger 1.4-m dishes (Oxford University) • Lower ground pickup, lower noise • Ground screen • Close-packed array • Concentrate on high-l excess and SZE in clusters • 9–12 months of observing before QUIET 2005 March 24
CBI2 2005 March 24
NVSS Sources in CBI Field 2005 March 24
GBT observations • Green Bank telescope 30 GHz measurements of NVSS sources in CBI fields • New Caltech Continuum Backend for switched observations • 1580 (of ~4000) sources observed so far under photometric conditions • 175 detected S > 2.5 mJy (5σ) at 32 GHz • Non-detections can be safely ignored in CBI! • Additional GBT observations to characterize faint source population • Brian Mason, Larry Weintraub, Martin Shepherd 2005 March 24
CBI2 Projection SZE Secondary CMB Primary ~ s87 2005 March 24
CBI Polarization Spectra • TT consistent with earlier results • EE and TE consistent with predictions • BB consistent with zero TT EE TE BB 2005 March 24
Shaped Cl Fit Likelihood of EE Amplitude vs. “TT Prediction” • Use WMAP’03+CBI TT+ Acbar best-fit Cl as fiducial model • Results for CBI • EE qB = 0.97 ± 0.14 (68%) • EE likelihood vs. zero : significance 10.1 σ • TE qB = 0.85 ± 0.25 • BB qB = 1.2 ± 1.8 μK2 2005 March 24
Comparison of Experiments 2005 March 24
Comparison of Experiments 2005 March 24
Comparison of Experiments 2005 March 24
θ/θ0 • Angular size of sound horizon at LSS should be same for TT and EE. • CBI only has multiple solutions (shift spectrum by one peak). • DASI removes degeneracy, but less sensitive. • CBI EE + DASI EE give scale vs. TT of 0.98 +/- 0.03. 2005 March 24
Isocurvature Isocurvature puts peaks in different places from adi- abatic. We use seed isocurvature model and find both EE and TE prefer adiabatic w/ iso consistent with zero. 2005 March 24
Isocurvature • Normalize seed iso spectrum to total power expected from TT adiabatic prediction • Fit shapes for both EE, TE • EE adi =1.00±0.24, iso=0.03±0.20 • TE adi = 0.86±0.26, iso=0.04±0.25 2005 March 24
WMAP Ka-band polarization Foregrounds DRAO 1.4 GHz polarized intensity (Wolleben et al. astro-ph/0510456) WMAP synchrotron component (WMAP Science Team) 2005 March 24
Foregrounds • TT: template comparisons • 2.5σ detection of correlation with 100 μm template • CHFT observations to provide SZ template • Polarization: No evidence (yet) for foreground contamination: • No B-mode detection • No indication of discrete sources (power ∝ l2) • Upper limit on synchroton component (DASI) 2005 March 24
WMAP3 WMAP3+CBIcombinedTT+CBIpol CMBall = Boom03pol+DASIpol +VSA+Maxima+WMAP3+CBIcombinedTT+CBIpol 2005 March 24
People 2005 March 24
http://astro.caltech.edu/~tjp/CBI/ • Readhead et al. 2004, ApJ, 609, 498 • Readhead et al. 2004, Science 306, 836 • Sievers et al. 2005, astro-ph/0509203 2005 March 24