Download
1 / 13
130 likes | 267 Vues
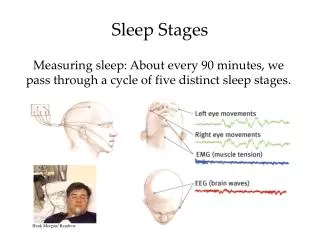
Analysis of REM and NREM stages in sleep. The viscous energy (hysteresis loop) lost in the viscoelastic material compare to elastic material. The area between the straining and relaxing curves for the brain represent the amount of the confined energy resulting from the viscous forces,

E N D
The viscous energy (hysteresis loop) lost in the viscoelastic material compare to elastic material • The area between the straining and relaxing curves for the brain represent the amount of the confined energy resulting from the viscous forces, • The confined energy degrades the elasticity property of the brain. It is needed to be recovered and sleeping perform the recovering functions. • For a no self-regulating system, this energy is converted into heat (Mechanical Behavior of Materials; Meyers and Chawla; 1999 ). But for the self-regulating brain it will consumes by internal reconfigurations (Model).
Hysteresis brain • One of the properties of a viscoelastic material is the property of being hysteresis. • A hysteresis system is dependent not only on its current environment but also on its past environment (A Rate-Independent Model for Inelastic Behavior of Shape-Memory Alloys; Mielke, A.; Roubicek, T.; 2003). • Brain is a viscoelastic material and has the hysteresis property (Model).
The self-regulating brain • The brain as a self-regulating system, does not waste this energy and it consumes that through some restructuring (synapses reconfiguration) and the stabilization of the restructuring (normalization of the energy over the involving layers) tasks. • Self-regulating systems repair their own parts by splitting parts to giver and receiver for inputs and outputs; or function periodically as a giver and in following the receiver to reconstruct itself. • Reconfiguration and normalization of the locations are the processes which the brain recover its elasticity property by that. • To recover the elasticity in the closed system of the sleeping brain, stepwise processes of reconfiguration and consumes the confined energy to improve the system. The accumulated confined energy will balance the energy used for reconfiguration and normalization of reconfigurations.
Sleeping brain is a closed system • Brain splits the confined energy between the two straining and relaxation curves in steps of reconfiguration and normalization. • The first portion between the daily straining and the steps of the accumulated energy as Δσ1*Δ 1 will be used for the reconfiguration and the second portion between the steps and the sleep relaxation curve as Δσ2*Δ 2 for the location stabilization or normalization over the brain layer (The Model).
The balancing of the releasing energy continues area by area, region by region; layer by layer; and finally throughout the brain. • These processes applies mostly to the outer and middle brains which have higher flowability and storage capacity for the stress flow and the confining strains (Model: Study of the Sleep Stages from a Physical Point of View),
A stepwise splitting of the two curves of straining and relaxation for the whole brain by combination of the individual area's curves for horizontal and vertical lines limited by the two straining and relaxing curves balances the energy which should be used in two different processes of synapses reconfiguration and normalization of the energy in brain as a whole.
The combination of the areas' individual straining-relaxation curves is so that the horizontal lines (de-straining keeping a constant stress load) and vertical lines (reducing of the stresses when the strains remain constant) match in time for all the areas in the brain (please refer to the "The relaxation curve for the whole layers of the brain is stepwise" the appendix II to the paper).
the steps between the two straining and relaxation curves, considering tissues protection from rupturing point, indicate the REM and NREM stages. • During a REM stage straining will reduce very slightly and can be assumed that strain remains approximately constant; and during a NREM stage stress forces will reduce very slightly and it can be assumed that stress remains about the constant. Therefore, conceptually, the steps between straining and relaxation curves shows that the required releasing steps to recover the wasted energy between straining and relaxation curves should be nulified and balanced for synapses reconfigurations and normalization of the energy over the brain layers (the Model).
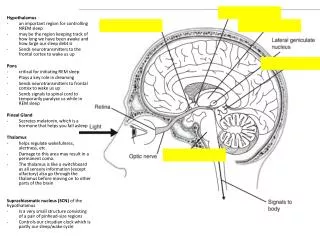
Analysing the straining and relaxation of the Thalamus in the middle brain • with increasing the number of the cycles, the curves will be shifted to right for the first cycle curve confining more strains. So, the higher the number of straining cycles; the higher the number of stages of releasing is required to recover the elasticity to the before the first cycle. Practically, the number of cycles should confirm the number of overstraining that brain experiences during a waking period.
Because the product of the lengths of the horizontal and vertical lines shows the approximate energy to be consumed in reconfiguration and distribution, NREM stages has significant role in initial phases of sleep while the role of longer periods of REM stages is more significant in the end of the sleep.
The horizontal steps of NREM in this shift of the curves to the left continue to split further sub-steps, before any vertical step of REM because of slips between horizontal lines of next shifting curves to the left. There is no shift of the curves in y direction; therefore no REM stage has a sub-stages.
Conclusions • The number of stages in all of the areas graph are generally five to eight. It is expected fora cumulative graph for the involved areas in the sleep typically approaches to eight. • The slip between next released states from right to left and from top to bottom, which is expected for a relaxing brain, indicate that there is a higher number of NREM stages in the begining of the sleep, while the number of REM stages is higher in the end of the sleep. With analysising the graphs the duration of stages can be interpretated for different poeple. Furthermore, the difference of the sleep stages pattern for children, young and adults individual can be answered according to the stress-strain analysis for dominant areas of the brain in different ages which function during sleep.