Download
1 / 29
290 likes | 422 Vues
CRAZ Ozone Analysis. Xin Qiu, Ph.D., ACM, EP May 3 rd , 2011. Objectives. Perform an analysis of the factors contributing to high ozone days in CRAZ Identify and assess the drivers for local and regional ozone formation Understand ozone formation mechanism as NOx-Limited vs VOC-Limited

E N D
CRAZ Ozone Analysis Xin Qiu, Ph.D., ACM, EP May 3rd, 2011
Objectives Perform an analysis of the factors contributing to high ozone days in CRAZ Identify and assess the drivers for local and regional ozone formation Understand ozone formation mechanism as NOx-Limited vs VOC-Limited Provide additional support to identify “back-out” situations
AQ Issues Primary Emissions Secondary Pollutants
Data and Models Nine Years of data (2001 -2009) • Meteorological Data • The National Climatic Data Center archives of surface and upper air data in North America • Air Quality Data • CASA measurements of ambient concentrations of ozone in/out of CRAZ Tools • HYSPLIT Back Trajectory Model • Synoptic Classification • Statistical Analysis
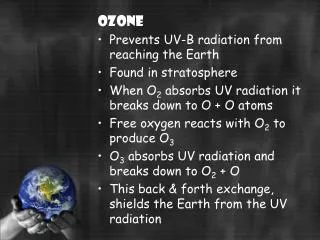
CRAZ High Ozone Days 2001 – 2009 Threshold: O3 8-hr mean > 58 ppb
Back Trajectory Model The Hybrid Single Particle Lagrangian Integrated Trajectory (HYSPLIT) model developed by the National Oceanic and Atmospheric Administration (NOAA) By incorporating receptor location coordinates, altitudes, run time, and meteorological data, the model provides back trajectory history from the receptor to the source over a given period of time.
Definitions Long-range: Clear stretch of trajectories from one direction; high ozone due to long-range transport from emission sources outside of Alberta. This is the case can be “backed out”. Local: trajectories are mostly localized, particularly at low and middle altitude. High ozone mainly due to local emissions and the Management Plan should be in place. Mixed-Range: trajectories are slightly beyond local (CRAZ) area, or the transport within province (e.g., transport from Edmonton). This is usually a complicated situation and we further look into case by case. Dominated Wind Direction: defined as the direction where air mass moves from according to the majority of back-trajectories.
The Concept of Air Mass • What is an air mass? • How is it related to basic meteorological parameters (temperature, pressure, winds, etc.)? • How is it different from analysis of basic meteorological parameters? • Source • Duration • Spatial coverage
Weather Pattern DM-P
Synoptic Air Mass Types** • Dry Polar (DP): Low temperature, clear sky, stable and dry air. Air mass is generally advected from cold north polar regions. • Dry Tropical (DT): The hottest and driest weather condition. Air is either advected from the USA, or produced by rapidly descending air. • Dry Moderate Polar (DM-P): Mild and dry, as modified dry polar air from the anticyclone system that dominates Alberta. • Dry Moderate Tropical (DM-T): Mild and dry, and usually as modified from tropical air mass originating from the United States. • Transitional (TR): During these days one weather type yields to another. • Moist Tropical (MT): Hot and humid. Typically found in summer warm sectors of mid-latitude cyclones or in a return flow of an anticyclone. • Moist Moderate (MM): Mild, cloudy, and unstable. Generally close to a warm front, as modified moist polar or moist tropical air. • Moist Polar (MP): Cool, humid, overcast. Winds are usually from the north or northwest. **Sheridan Spatial Synoptic Classification system (2001) (http://sheridan.geog.kent.edu/ssc.html)
8% 15% 67% 10%
Air Mass/ Air Quality Dry Moderate (DM), Dry Tropical (DT), and the Dry Polar (DP), are always among the top three circulation patterns associated with the high Ozone concentrations. DM shows highest frequency associated with ozone concentrations. DM has westerly or southwesterly flow No high ozone event found in MT, MM &MP Local and Mixed-range mostly associated with DM
Temperature 83% of total high ozone days were associated with temperatures greater than 18οC 100% local high ozone events are associated with temperature higher than 18οC 80% mixed-range high ozone events are associated with temperature higher than 18οC
Ozone Isopleths VOC Limited NOx Limited
NOx/VOC Ratios 1/8
NOx/VOC Ratios NOx/VOC ratios in Calgary were much higher than in Red Deer; NOx/VOC ratios in Calgary were greater than 1/8, VOC-Limited Most NOx/VOC ratios in Red Deer were less than 1/8 NOx-Limited Larger variations in NOx/VOC ratios were found in Calgary than in Red Deer
Summary - 1 • Long-range transport: 52% (”back-out”) • Local: 27% • Mixed range: 21%
Summary - 2 More than 66% of the high ozone days occurred under DM-T and DM-P weather patterns, with 40% long-range transport, 35% local and 25% mixed range accounted for 35% and 25%. Local transport is strongly related to DM-P weather patterns Mixed-range transport is mostly related to DM weather types. Required further investigation.
Summary -3 CRAZ has both VOC-limited and NOx-limited ozone formation regimes. In urban area (City of Calgary), a VOC-limited mechanism dominated mostly In rural area, it’s likely a NOx-limited mechanism In suburban area, it’s depended upon air mass and urban plume (uncertainty remains)
Uncertainties/Limitations HYSPLIT has limitations Only 3 CRAZ monitoring stations & located in urban area Anthropogenic emissions were not included in the analysis Biogenic VOC emissions were not included in the analysis Lack of data to identify ozone formation in sub-urban area
Dr. Xin Qiu, EP, ACM 416-320-1363 xinq@novusenv.com