Download
1 / 2
20 likes | 264 Vues
Evaluation of HACH Procedures for the Determination of Phosphate in Water Orosz, Maria T., Mutti, Laurence J. Department of Geology at Juniata College. Abstract

E N D
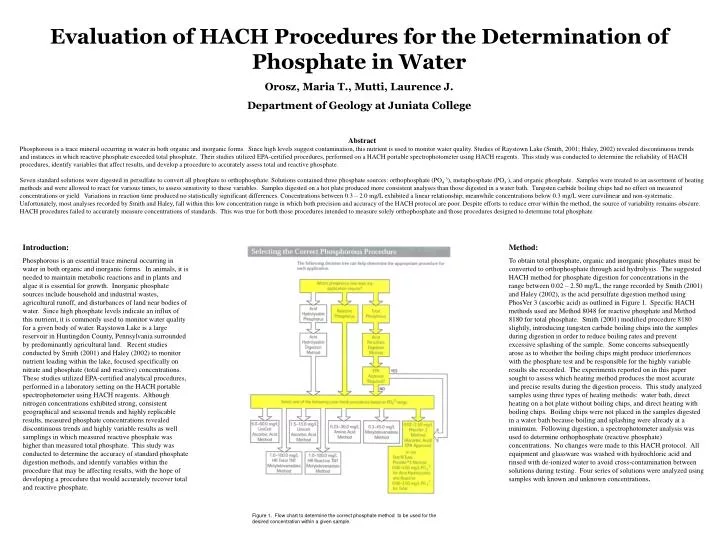
Evaluation of HACH Procedures for the Determination of Phosphate in Water Orosz, Maria T., Mutti, Laurence J. Department of Geology at Juniata College Abstract Phosphorous is a trace mineral occurring in water in both organic and inorganic forms. Since high levels suggest contamination, this nutrient is used to monitor water quality. Studies of Raystown Lake (Smith, 2001; Haley, 2002) revealed discontinuous trends and instances in which reactive phosphate exceeded total phosphate. Their studies utilized EPA-certified procedures, performed on a HACH portable spectrophotometer using HACH reagents. This study was conducted to determine the reliability of HACH procedures, identify variables that affect results, and develop a procedure to accurately assess total and reactive phosphate. Seven standard solutions were digested in persulfate to convert all phosphate to orthophosphate. Solutions contained three phosphate sources: orthophosphate (PO4-3), metaphosphate (PO3-), and organic phosphate. Samples were treated to an assortment of heating methods and were allowed to react for various times, to assess sensitivity to these variables. Samples digested on a hot plate produced more consistent analyses than those digested in a water bath. Tungsten carbide boiling chips had no effect on measured concentrations or yield. Variations in reaction time produced no statistically significant differences. Concentrations between 0.3 – 2.0 mg/L exhibited a linear relationship; meanwhile concentrations below 0.3 mg/L were curvilinear and non-systematic. Unfortunately, most analyses recorded by Smith and Haley, fall within this low concentration range in which both precision and accuracy of the HACH protocol are poor. Despite efforts to reduce error within the method, the source of variability remains obscure. HACH procedures failed to accurately measure concentrations of standards. This was true for both those procedures intended to measure solely orthophosphate and those procedures designed to determine total phosphate. Introduction: Phosphorous is an essential trace mineral occurring in water in both organic and inorganic forms. In animals, it is needed to maintain metabolic reactions and in plants and algae it is essential for growth. Inorganic phosphate sources include household and industrial wastes, agricultural runoff, and disturbances of land near bodies of water. Since high phosphate levels indicate an influx of this nutrient, it is commonly used to monitor water quality for a given body of water. Raystown Lake is a large reservoir in Huntingdon County, Pennsylvania surrounded by predominantly agricultural land. Recent studies conducted by Smith (2001) and Haley (2002) to monitor nutrient loading within the lake, focused specifically on nitrate and phosphate (total and reactive) concentrations. These studies utilized EPA-certified analytical procedures, performed in a laboratory setting on the HACH portable spectrophotometer using HACH reagents. Although nitrogen concentrations exhibited strong, consistent geographical and seasonal trends and highly replicable results, measured phosphate concentrations revealed discontinuous trends and highly variable results as well samplings in which measured reactive phosphate was higher than measured total phosphate. This study was conducted to determine the accuracy of standard phosphate digestion methods, and identify variables within the procedure that may be affecting results, with the hope of developing a procedure that would accurately recover total and reactive phosphate. Method: To obtain total phosphate, organic and inorganic phosphates must be converted to orthophosphate through acid hydrolysis. The suggested HACH method for phosphate digestion for concentrations in the range between 0.02 – 2.50 mg/L, the range recorded by Smith (2001) and Haley (2002), is the acid persulfate digestion method using PhosVer 3 (ascorbic acid) as outlined in Figure 1. Specific HACH methods used are Method 8048 for reactive phosphate and Method 8180 for total phosphate. Smith (2001) modified procedure 8180 slightly, introducing tungsten carbide boiling chips into the samples during digestion in order to reduce boiling rates and prevent excessive splashing of the sample. Some concerns subsequently arose as to whether the boiling chips might produce interferences with the phosphate test and be responsible for the highly variable results she recorded. The experiments reported on in this paper sought to assess which heating method produces the most accurate and precise results during the digestion process. This study analyzed samples using three types of heating methods: water bath, direct heating on a hot plate without boiling chips, and direct heating with boiling chips. Boiling chips were not placed in the samples digested in a water bath because boiling and splashing were already at a minimum. Following digestion, a spectrophotometer analysis was used to determine orthophosphate (reactive phosphate) concentrations. No changes were made to this HACH protocol. All equipment and glassware was washed with hydrochloric acid and rinsed with de-ionized water to avoid cross-contamination between solutions during testing. Four series of solutions were analyzed using samples with known and unknown concentrations. Figure 1. Flow chart to determine the correct phosphate method to be used for the desired concentration within a given sample.
For Series #1 two sets of standard solutions, as outlined in the HACH Standard Methods, were prepared and digested, incorporating all three sources of phosphate: orthophosphate (PO4-3), metaphosphate (PO3-), and organic phosphate. Orthophosphate was obtained from Na3PO4 ·12 H2O, metaphosphate from NaPO3, and organic phosphate from adenosine 5+ - monophosphoric acid (ADP). Phosphate sources were weighed (to a precision of milligrams) and mixed with one liter of de-ionized water to prepare a stock solution and were then diluted with de-ionized water (milliliter) in ratios of 100 (stock): 900 (DI) (Run #1) and 10(P): 990 (DI) (Run #2). Series #2 was designed to test only for reactive phosphorous, requiring only a source of orthophosphate. KH2PO4 (potassium phosphate monobasic)was substituted for Na3PO4 ·12 H2O in this and all subsequent tests because of uncertainties about the amount of potential absorbed water present in off-the shelf Na3PO4 ·12 H2O. Seven standard solutions were prepared using a series of dilutions composed of KH2PO4 and de-ionized water. For each of the seven samples, five runs were preformed in which each run was allowed to react for two, four and six minutes prior to measurement to assess the sensitivity of the technique to the time variable. The third series of analyses tested for both reactive and total phosphate. Reactive phosphate and total phosphate were recovered using the aforementioned methods. Originally, eight standard stock solutions were prepared and diluted using all three sources of phosphate combined with de-ionized water. However, only two stock solutions (B and D) were actually processed. For Series #4, five river water samples from five different locations containing unknown phosphate concentrations were tested for both total and reactive and reactive phosphate. The only heating method utilized during digestion was a hot plate without boiling chips. In addition two standard solutions were prepared by diluting a known amount of KH2PO4 with a volume of river water to test for recovery of reactive phosphorous and the presence in natural waters of possible interfering solutes. Each test was performed under a range of pH conditions, to assess the sensitivity of the technique to these variables. For all of these analyses either four or five replicate samples were prepared and analyzed to assess analytical precision. Following the completion of all four series of analyses, each variable was evaluated to determine the most accurate method. Discussion: The variables within the total phosphate digestion process of Series 1 were variations in heating method and the use of tungsten carbide boiling chips. Graphs 1 and 2 depict comparisons among the heating methods for standard samples at comparatively high concentration (Run #1) and intermediate concentration (Run #2). In Graph 1, phosphate concentrations often exceeded the detection limit of the spectrophotometer at 2.75 mg/L. Standard deviation was the lowest for samples digested directly on the hot plate with boiling chips. Variation for these measurements was only one-half that of the samples directly heated without boiling chips and one-quarter of that for samples digested in a boiling water bath. There were complications using the water bath technique in that buoyancy tended to cause the flasks to tip and spill. For the intermediate concentration standards (Run #2) direct heating on a hot plate without boiling chips produced the lowest standard deviation. Since Graph 2 represents concentrations within the range recovered by Smith (2001) and Haley (2002), it is thought to most accurately represent our data. Heating method was also tested during Series #3 for Stock Solutions B and D. This data is illustrated in Graphs 3 and 4. In Graph 3, phosphate concentrations within the prepared solutions were similar to the intermediate concentration standards of Run #2. The water bath and the hot plate without boiling chips had equal standard deviations, while the hot plate with boiling chips exhibited the highest standard deviation. Graph 4, which depicts concentrations within the low part of the testing range, illustrates a very high standard deviation for the water bath. No phosphate at all was detected for those samples heated on hot plate without boiling chips, but these analyses are represented in the graph at concentration of 0.001. The standard error at concentrations this low is such as to make the analyses meaningless. For Series #3 as a whole, the method of digesting on a hot plate without boiling chips produced the most consistent results. In addition, careful observation during digestion noted very little splashing with or without the tungsten carbide boiling chips. Therefore since the original procedure does not instruct the use of boiling chips, and measurements were more consistent in their absence, we conclude that they are unnecessary. There is, however, no evidence that boiling chips have a systematic effect on measured concentration levels, as had been feared. Series #2 was designed to test the accuracy of the HACH technique across the recommended concentration range, and to assess whether the results would behave in a sufficiently consistent fashion to enable the construction of standardization curves. Another variable was simultaneously evaluated during Series #2, that being the sensitivity of the technique to reaction time prior to analysis (the HACH procedure specifies a precise time of two minutes). We monitored this sensitivity by taking replicate readings on the same samples following reaction times of two, four, and six minutes. Graph 5 illustrates our results. The most important results pertain to the accuracy of the technique across range. At concentrations levels above 0.03 mg/L all of the measurements are co-linear and therefore could in principle be corrected for systematic error; however, Graph 6, which expands the view for concentrations less than 0.03 mg/L, reveals a non-systematic relationship between the observed concentrations and target values. The HACH procedure is, therefore, inadequate to accurately determine phosphate at concentrations below approximately 0.03 mg/L. We are unclear about the source of the deviation between measured and target concentrations in the linear range. Some possibility of error exists in the preparation of the standards, given that the quantities of reagent required to make accurate standards at these low concentrations demands extremely precise weighing. There were no significant differences in measured concentrations given an extended reaction time. Therefore, extreme care in timing during the analytical process is not essential. Phosphate Concentration (mg/L) Graph 1. Series #1 Heating Methods: High Concentrations for Run #1 Graph 2. Series #1 Heating Methods: Intermediate Concentrations for Run #2 Graph 3. Series #1 Heating Methods: Intermediate Concentrations for Stock B Graph 4. Series #1 Heating Methods: Low Concentrations for Stock D Graph 5. Series #2 Actual Concentrations vs Experimental Concentrations Graph 6. Actual Concentrations vs Experimental Concentrations below 0.2 mg/L Conclusion: Samples digested directly upon a hot plate produced somewhat more consistent analyses than did those digested in a boiling water bath. Additionally, the use of tungsten carbide boiling chips had no effect on measured phosphate concentrations, neither increasing nor decreasing yield. Although measured concentrations were slightly more accurate given a prolonged reaction time, there were no statistically significant differences among results. Graphs were constructed to examine the relationship between actual concentrations and standard concentrations. Concentrations between 0.03 – 2.0 mg/L exhibited a linear relationship which could be modified to fit standard curves; concentrations below 0.03 mg/L have to be considered below reliable measurement. Unfortunately, many of the phosphate analyses recorded by Smith and Haley for samples from Raystown Lake, fall within this extremely low concentration range in which both precision and accuracy of the HACH protocol are poor. References American Public Health Association et al., 1981, Standard Methods for the Examination Water and Wastewater: Washington, D.C., American Public Health Association. HACH Company, 1994, HACH Water Analysis Handbook: Loveland, CO, HACH Company, 2nd Ed., p. 487-488, 509-511. Haley, C. J., 2002, Nutrient Concentrations and Temporal Variations: A Study of Phosphates and Nitrates in Raystown Lake, PA, Juniata College Undergraduate Research Sympsium. Smith, J.L. 2001, Nutrient Concentrations in Raystown Lake, Juniata CollegeUndergraduate Research Symposium. Wetzel, R. G., 2001, Limnology: Lake and River Ecosystems: San Diego, CA, Academic Press, 3rd Ed., p. 239-288.