Download
1 / 31
310 likes | 393 Vues
JScientificCalculator. Group We<3Dobbins. JScientificCalculator. Group We<3Dobbins Staff. We<3Dobbins Staff. Managers Chris Buzzerd ( Repository) Michael Kelleher ( Process) Allison Corey ( Website) Brandon Grant ( Docs) Erik Dacosta ( Contact). We<3Dobbins Staff. Code Developers

E N D
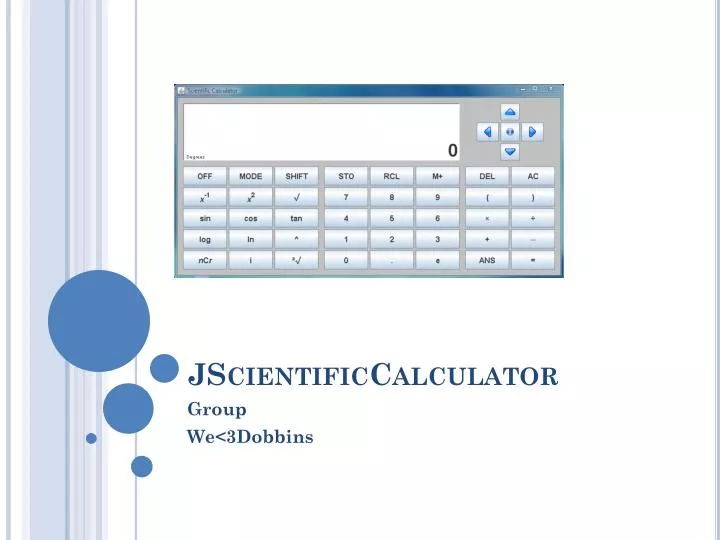
JScientificCalculator Group We<3Dobbins
JScientificCalculator Group We<3Dobbins Staff
We<3Dobbins Staff • Managers • Chris Buzzerd (Repository) • Michael Kelleher (Process) • Allison Corey (Website) • Brandon Grant (Docs) • Erik Dacosta (Contact)
We<3Dobbins Staff • Code Developers • Joey Reaves • Chris Rock • Danial Afzal • Rex Robinson • Ross Friedberg • Kiyotaka Iwataki
We<3Dobbins Staff • GUI Developers/Designers • Robert Krieger • Bruce Shaw • Long Mai • Erik DaCosta • Allison Corey • Brandon Grant
JScientificCalculator Testing Procedure
Test Plan • 1.0 Testing Process • 1.1 Integration Testing • 1.2 Release Testing Procedures • 1.3 Performance Testing • 2.0 Requirements Traceability • 2.1 Numbering System (X.Y) X – Requirement number Y – Test case number for requirement • 2.2 Other Information: For all requirement test cases, it is assumed that the first case step is to successfully compile, and then run the program. “Selecting” a button or numeral simply means clicking on it. • 2.3 Test Cases • 3.0 Schedule • 4.0 Recording Procedure • 4.1 Results Reporting • 4.2 Documenting Success • 4.3 Analysis • 5.0 Constraints • The only foreseeable constraints relating to this Java Scientific and Graphing Calculator relate to the Graphical User Interface. Buttons for requirement functions must be added in order for requirements to be tested as part of the system.
JScientificCalculator Increment One
Work Assignments Week 1 • Code Team • Research ways to code/implement graphing area. • Create code to handle multiple variables. (store to a variable) • Create code to handle absolute value function. • GUI Team • Research Cartesian Plane / Bounds in JAVA • Create GUI for Absolute Value option • Create GUI framework for Cartesian Graphing Utility • Create GUI for Multiple Variables option
Work Assignments Week 2 • Code Team • Research ways to code/implement graphing area. • Create code to handle multiple variables. (store to a variable) • Create code to handle absolute value function. • GUI Team • Research and implement Cartesian Plane. • Finish GUI framework.
Returns the absolute value of the expression. 1 Screenshots: Shift Mode
Summary Because of the difficulty of some of the requirements and internal miscues, the increment was not completed. To remedy the problem, three requirements were removed, and the schedule was reshuffled to evenly distribute anticipated weekly workloads.
JScientificCalculator Increment Two
Work Assignments Week 3 • Code Team • Implement Graphing. • Implement Greatest Common Denominator and Least Common Multiple. • Code inputting equations for graphing. • Code ways to handle Multiple Variables • GUI Team • Create GUI for GCD, LCM, x, d/dx, and Multiple Variables. • Update Documentation.
Work Assignments Week 4 • Code Team • Finish LCM and GCD. • Implement Coordinate Finder. • Finish Multiple Variables. • GUI Team • Add X: and Y: fields and a find button to the Graph. • Add Intersect, Clear, and Delete buttons to Graph panel. • Create equation scroll box on the Graph panel.
Graphs the current equation in the screen Graphs the derivative of the current equation in the screen Returns the Greatest Common Denominator of two numbers Returns the Least Common Multiple of two numbers The “x” variable button The “Z” variable button 3 4 1 2 Screenshots: Shift Mode 5 6
Graphing are X coordinate search Y coordinate search Activate coordinate search Active equations Displays equation intersections Deletes highlighted function Deletes all functions Changes window bounds Refreshes the graph panel. 1 Screenshots: Graph Panel 3 2 4 6 5 7 8 10 9
Summary The function to determine the Intersection of two equations was added back to the program. It was one of the functions removed from the project because of its complexity and time restraints. All outstanding requirements from Increment One were finished except for some implementation hold ups with Multiple Variables, and with Increment Two, with the re-addition of Intersection, Trace and Coordinate Finder were stalled to get a head start on its implementation.
JScientificCalculator Increment Three
Work Assignments Week 5 • Code Team • Complete Trace and Coordinate finder. • Finalize Multiple Variables. • Finish and Integrate Intersection. • Modify Mode button to switch graphing modes. • GUI Team • Implement a means to display function intersections. • Create finalized Test Cases.
Work Assignments Week 6 • Code Team • GUI Team