Download
1 / 35
350 likes | 768 Vues
Solid, Toxic, and Hazardous Waste. Outline. What Do We Do with Waste? Shrinking the Waste Stream Recycling Hazardous and Toxic Wastes Federal Legislation RCRA CERCLA Management Options. U.S. Domestic Waste. FIGURE 21.2. Waste Disposal Methods. Open Dumps Release Hazardous Materials

E N D
Outline • What Do We Do with Waste? • Shrinking the Waste Stream • Recycling • Hazardous and Toxic Wastes • Federal Legislation • RCRA • CERCLA • Management Options
U.S. Domestic Waste FIGURE 21.2
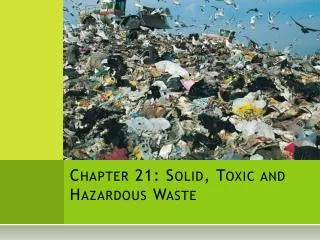
Waste Disposal Methods • Open Dumps Release Hazardous Materials • Open, unregulated dumps are still the predominant method of waste disposal in developing countries. • Most developed countries forbid open dumping. • Estimated 200 million liters of motor oil are poured into the sewers or soak into the ground each year in the U.S. • About five times volume of Exxon Valdez oil spill
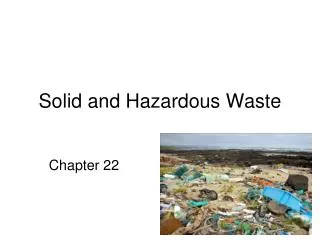
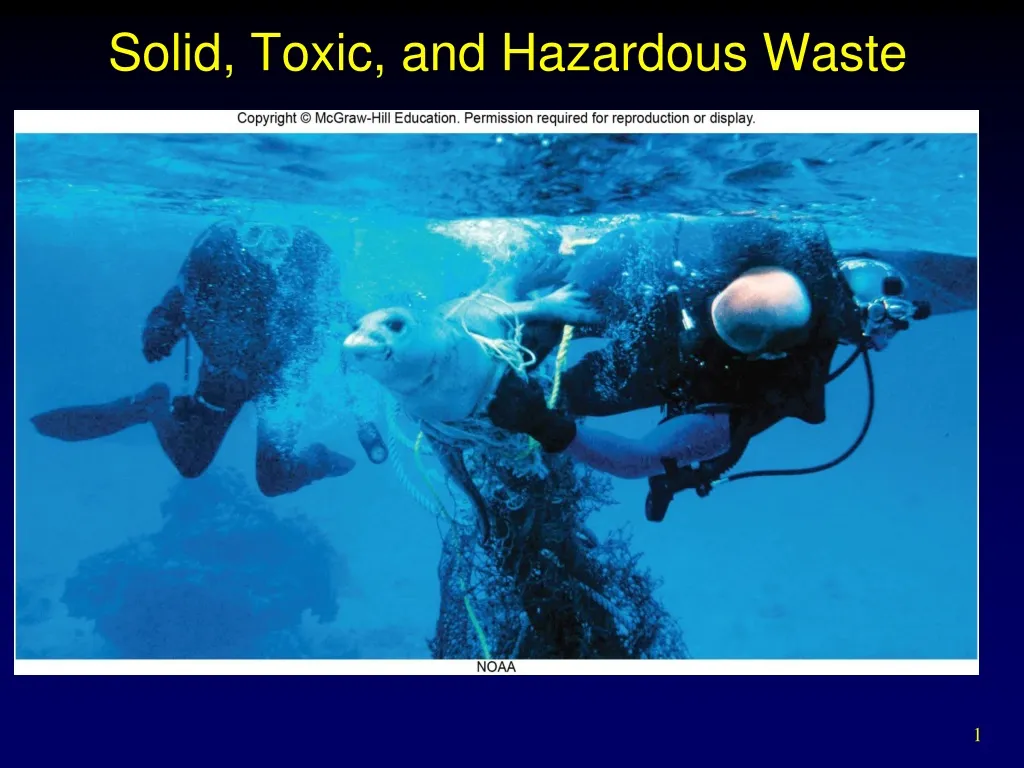
Waste Disposal Methods Ocean dumping is nearly uncontrollable • Every year 20 million tons of plastic debris are dumped at sea where they are eaten by wildlife or wash up on beaches, even in remote regions. • In the North Pacific alone, 50,000 northern fur seals are entangled in refuse and in the 1,000 km of fishing nets lost each year. They drown or starve to death.
Waste Disposal Methods • We Often Export Wastes To Other Countries • Industrialized nations have agreed to stop shipping hazardous and toxic waste to less-developed countries, but it still continues. • About 80% of electronic waste (e-waste) is shipped abroad, mostly to Asia and Africa where it is broken apart to salvage metals. • The remaining material is thrown into open dumps causing soil and water contamination. • Much of this e-waste are outdated televisions, computers, game consoles and cell phones.
A Chinese Woman Extracts Valuable Metals From E-Waste FIGURE 21.6
Waste Disposal Methods • Sanitary Landfills • Refuse compacted and covered every day with a layer of dirt • Dirt takes up as much as 20% of landfill space • Since 1994, all operating landfills in the U.S. have been required to control hazardous substances with lining and drainage systems.
Landfills • Historically, landfills have been a convenient, inexpensive waste-disposal option. • Rising land prices and shipping fees, and demanding construction and maintenance requirements, are increasing costs. • Suitable landfill sites are become scarce • The cost of disposing of a ton of solid waste in Philadelphia went from $20 in 1980 to more than $100 in 2010. • Positive trend in landfills is methane recovery
Waste Disposal Methods • Incineration (also called Energy Recovery) • Energy Recovery - heat derived from incinerated refuse is a useful resource • Burning garbage is used to create steam used for heating buildings or generating electricity. • Internationally, there are well over 1,000 such waste to energy plants that reduce garbage while generating needed energy.
Incinerator Types • Refuse-Derived Fuel - refuse is sorted to remove recyclable and unburnable materials • Higher energy content than raw trash • Mass Burn - everything smaller than major furniture and appliances loaded into furnace • Creates air pollution problems • Reduces disposal volume by 80-90% • Residual ash usually contains toxic material.
Mass-Burn Incinerator FIGURE 21.9
Incinerator Cost and Safety • Initial construction costs are usually between $100 and $300 million for a typical municipal facility. • Tipping fees (cost to dump 1 ton) are often much higher than tipping fees at landfills. • EPA has found alarmingly high levels of dioxins, furans, lead and cadmium in ash. • One way to control this is to remove heavy metals (batteries) and plastics before burning.
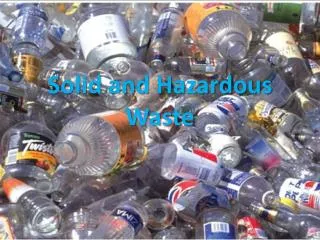
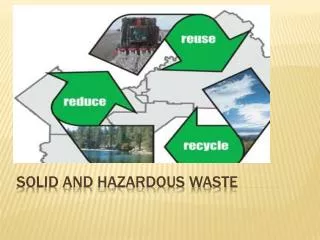
Shrinking the Waste Stream • Recycling • Recycling is the reprocessing of discarded materials into new, useful products. • Currently, about half of all aluminum cans are recycled. • Old tires are turned into road surface • Newspapers become insulation • Recycling copper is so lucrative that thieves are stealing copper pipes and wires causing gas leaks and explosions.
Recycling • Benefits • Saves money, raw materials, and landfill space • Curbside pickup of recyclables costs around $35 per ton, as opposed to the $80 paid to dispose of them at an average metropolitan landfill. • Reduces pressure on disposal systems • Japan recycles about half of all wastes • Lowers demand for raw resources • Reduces energy consumption and air pollution
Recycling • Present policies tend to favor use of new raw materials because energy, raw materials, and water are often sold below real cost to create jobs and stimulate the economy. • You can help by reducing and reusing first and buying recycled products when you must purchase new materials.
Disposal of Municipal Waste U.S. Recycling Rates
Commercial Scale Recycling and Composting • Compost yard waste at the municipal level • Yard waste makes up 13% of waste stream. • Swiss company uses yard waste to make methane. • Construction waste can be recycled. • Gasifiers convert biomass (food-soaked paper) to natural gas.
E-Waste • Demanufacturing is the disassembly and recycling of obsolete appliances and electronics. • Most office machines are used 3 years; most TVs used 5 years; 300 million computers await disposal • 70% of heavy metal contamination comes from e-waste, and batteries make up another 10% to 20%. • In Europe, manufacturers have “cradle to grave” responsibility for their products.
Reuse is More Efficient Than Recycling • Auto parts, brass fittings, woodwork, bricks, are routinely reused and can bring a high price. • Glass and plastic bottles are washed and refilled. • In developing countries, poor people make a living by scavenging, sorting and reprocessing scraps from dumps.
Aim: How can we best deal with our waste? • Do Now: Watch the videos • Identify the overlying problem the video addresses • What is the reason this problem exists? • What are the consequences? • How can we best deal with this problem? (the problem as a whole, not just specifically what you saw in the video)
Shrinking the Waste Stream • Producing Less Waste • Excess packaging of consumer products is one of our greatest sources of unnecessary waste. • Paper, plastic, glass, and metal packaging material make up 50% of domestic trash. We can: • Decrease unnecessary packaging; • Increase use of photodegradable and biodegradable plastics. • The European Union now requires cradle-to-grave responsibility for electronic products. Should the U.S. do the same?
Hazardous waste • Legally, a hazardous waste is any discarded material, liquid or solid, that contains substances known to be: • Fatal to humans or laboratory animals in low doses • Toxic, carcinogenic, mutagenic, or teratogenic to humans or other life-forms • Ignitable with a flash point less than 60°C, • Corrosive • Explosive or highly reactive.
Hazardous and Toxic Wastes • EPA estimates U.S. industries generate 265 million metric tons of officially classified hazardous wastes annually. • At least 40 million metric tons of toxic and hazardous wastes are released into the environment each year. U.S. Hazardous Waste Producers
Hazardous Waste Disposal • Federal Legislation • Resource Conservation and Recovery Act (RCRA) - 1976 • Comprehensive program requiring rigorous testing and management of toxic and hazardous substances • “Cradle (point of generation) to grave (ultimate disposal)” accounting
Federal Legislation • Comprehensive Environmental Response, Compensation and Liability Act (CERCLA) 1980 • Modified by Superfund Amendments and Reauthorization Act (SARA) 1984 • Aimed at rapid containment, cleanup, or remediation of abandoned toxic waste sites • Establishes a community “right to know” • Toxic Release Inventory - Requires 20,000 manufacturing facilities to report annually on releases of more than 300 toxic materials
Tracking Cradle to Grave FIGURE 21.19
CERCLA • Government does not have to prove anyone violated a law or what role they played in contaminating a superfund site • Liability under CERCLA is “strict, joint, and several”, meaning anyone associated with a site can be held responsible for the entire clean-up cost • CERCLA amended in 1995 to allow containment if treatment is unavailable or too costly
Superfund Sites • EPA estimates 36,000 seriously contaminated sites in the U.S. General Accounting Office says 400,000 sites. • By 2016, some 1,170 sites were on the National Priority List (NPL) for cleanup. • Superfund is a revolving pool designed to: • Provide immediate response to emergency situations posing imminent hazards; and • Clean-up abandoned or inactive sites. • In 1995 Congress let the “polluters pay” tax expire. • Today, tax payers absorb the cost of clean up.
Superfund Sites • Total costs for hazardous waste cleanup in the U.S. are estimated between $370 billion and $1.7 trillion of taxpayer money. • Reliance on general funds makes cleanup progress vulnerable to political winds in Congress. • Studies of Superfund sites reveal minorities tend to be over-represented in these neighborhoods.
Brownfield Liabilities and Opportunities • Brownfields - contaminated properties that have been abandoned or are not being used up to potential because of pollution concerns • Up to one-third of all commercial industrial sites in urban core of many big cities fall into this category. • In many cases, property owners complain that unreasonably high purity levels are demanded in remediation. • Providing liability insurance against future cleanup costs is beneficial in reusing brownfields.
Hazardous Waste Management Options • Produce Less Waste • Avoid creating wastes in the first place • Recycle and Reuse - what is waste to one industry is raw product for another • Use less toxic alternative • Convert to Less Hazardous Substances • Physical Treatment (Isolation) • Incineration • Chemical Processing (Transformation to non-toxic substances) • Bioremediation (Microorganisms detoxify)
Hazardous Waste Management Options • Store Permanently • Retrievable Storage - in containers in salt mines or caverns • Can be inspected and periodically retrieved if necessary • Secure Landfills • Modern, complex landfills with multiple liners and other impervious layers, covered by a cap. Leachate is processed and monitoring sees that no toxins escape.
Toxic Waste Secure Landfill FIGURE 21.24
Toxic Waste Storage • Transportation of hazardous wastes to disposal sites risks accidents • Of particular concern in densely packed urban corridors • Another worry is who will bear financial responsibility for abandoned waste sites. • We may need new institutions for perpetual care of toxic wastes and nuclear wastes.