Download
1 / 37
370 likes | 374 Vues
Paul Brown Mike Leuthold University of Arizona. DEVELOPMENT OF A NEW LETTUCE ICE FORECAST SYSTEM FOR YUMA COUNTY. BRIEF HISTORY. Original Lettuce Ice Forecast Program National Weather Service (NWS) Issue Through ~1997 NWS Reorganization (1996-97)

E N D
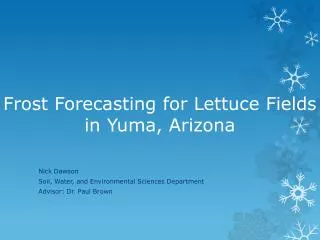
Paul Brown Mike Leuthold University of Arizona DEVELOPMENT OF A NEW LETTUCE ICE FORECAST SYSTEM FOR YUMA COUNTY
BRIEF HISTORY • Original Lettuce Ice Forecast Program • National Weather Service (NWS) • Issue Through ~1997 • NWS Reorganization (1996-97) • Closed Yuma Office & Ended NWS Ag Forecasts • Grower Interest • Request to Reestablish Program • Request to NWS for Yuma Model • “Search” of Yuma Office Records • No Model Located • About 9-11
HISTORY CONTINUED • AZMET Seminar • U of A Atmospheric Science Dept. • High Resolution Forecast Model • Interested In Agriculture Forecasts • USDA Specialty Crops Grant • Develop Lettuce Ice Forecast System • Using High Resolution Forecast Model • Project Funded & Initiated in Oct. 2010
PROGRAM GOALS Provide high resolution temperature and ice forecasts for lettuce producers in Yuma Co. Collect field data consisting of temperature, humidity and wind speed at shelter level, and temperature and leaf moisture at lettuce level to both improve and validate the accuracy of forecasts.
WEATHER MODELS Used To Forecast Development & Movement of the Atmosphere Wednesday @ 5pm Thursday @ 5pm
ANATOMY OF A WEATHER MODEL Earth Surface is Divided Into Segments or Grids. Atmosphere Above Each Grid Area Is Then Layered. Observational Data Are Used To Estimate Conditions At Each Grid Point. Model Uses Complex Mathematics Determine How Atmosphere Will Evolve.
WEATHER RESEARCH & FORECAST (WRF) MODEL This model is presently used by NWS to forecast weather for the region shown above. The model divides the atmosphere into 60 layers, operates on a 12 km (6.2 mile) grid spacing and forecast out to 84 hours (3.5 days).
UNIVERSITY OF ARIZONA MODIFICATIONS TO WRF MODEL • Model Core Adjusted For AZ Conditions • Atmosphere • Clouds • Precipitation • Much Higher Resolution • 1.5 km (0.9 miles) • Handles Complex Topography Better • Better Land Surface Characterization
GRID SPACING/RESOLUTION Current NWS Models Large Grid Spacing Grid-Wide Topography, Land Use & Initial Conditions Model Generates Forecast for Grid Region
GRID SPACING/RESOLUTION UA WRF Models Smaller Grid Spacing Better Separation of Land Characteristics Improved Assessment of Topography & Air Drainage
PROJECT SCHEMATIC Provide Accurate High Resolution Winter Temperature Forecasts WRF MODEL COMPUTER MONITORING REFINEMENT Initialize Model Generate Forecast Ground Truth Adjust Model Repeat Process
PROJECT TIMELINE YEAR 1 • Set Up Model for Yuma Co. • Prototype Forecasts • Install Monitoring Equip. • Refine Forecast Model YEAR 2 • Operational Forecasts • Continue Monitoring • Validate Model Accuracy YEAR 3 • Operational Forecasts • Industry Funded • Part of AZMET
PROJECT STATUS • Forecast Model • Functional & Available Via Web • Graphic Forecasts • Text Forecasts • Working on Adjustments • Monitoring Systems • Functional & Available Via Web • Graphical Summaries • Text Summaries • Raw Data
GRAPHIC FORECASTS • Graphic Forecasts For Next 48 Hours • Hourly Maps Providing… • Temperature @ Shelter Height (2m or 6.5’) • Dew Point @ Shelter Height • Wind Speed & Direction • Hourly Maps Providing • Surface Temperature (Crop Level)
SHELTER & “SURFACE” LEVELS Shelter Height (2m or 6’5”) Lettuce Height (30 cm or 1’)
GRAPHIC FORECAST Shelter Conditions • Elevation • Roads • Urban Area • Weather • Temperature • Color • Text • Dew Point • Wind Conditions Shelter Conditions At 6 a.m. on March 9
GRAPHIC FORECASTS Shelter Conditions Shelter Conditions At 8 p.m. on March 9
GRAPHIC FORECASTS Surface Temperatures Forecast for 6 a.m. on March 10th
TEXT FORECASTS • Text Forecasts For Next 48 Hours • Maximum & Minimum Tempertures • Quantitative Precipitation • Hourly Forecasts Of… • Shelter Temperature • Dew Point
WEATHER & PRECIPITATION FORECAST Quantitative Precipitation Forecasts Amounts Rather Than Probability
HOURLY FORECASTS (TEXT) Shelter Temperature, Surface Temperature & Dew Point Tomorrow Shelter: 45F Tomorrow Surface: 40F Day 2 Shelter: 45F Day 2 Surface: 40F
INTERNET ACCESS http://www.atmo.arizona.edu/index.php?section=weather&id=wrf
LOCAL MONITORING Model Improvement/Validation • Roll • Dome Valley • US95 & 5E • Yuma Ag Ctr • 14th & G • 18th & F3/4 • AZMET • Yuma Valley • Yuma South • Yuma N. Gila • Roll
MONITORING SYSTEMS Temperature Humidity Wind Speed Temperature Leaf Wetness
INTERNET ACCESS http://ag.arizona.edu/azmet/ls.htm
MONITORING DATA Graphical Output Update Each Hour Temperature, Dew Point and Wind Speed @ Shelter Height Lettuce Level Temperature, & Dew Point Leaf Wetness
MONITORING DATA Text Output Updated Each Hour
INTERNET ACCESS Raw Data Available For Use/Analysis
RESEARCH CHALLENGES Model Forecast: 16 m Heat Wind Radiation Condensation ?? Lettuce Level 0.3 m Soil Type, Soil Moisture, Vegetation Heat
INTERATIVE PROCESS WRF MODEL COMPUTER MONITORING REFINEMENT Initialize Model Generate Forecast Ground Truth Adjust Model Repeat Process
EXPANSION OF MONITORING • Acceptable Within Limits • Strategic: Forecast Improvement • Costs Must Be Covered • Equipment • Operations
GROWER MEETINGS • Feedback on Forecasts/Program • Forecast & Website Training • Expansion of Monitoring Program • Alternate Delivery Systems • Text Msgs • Twitter • Facebook