Download
1 / 21
240 likes | 566 Vues
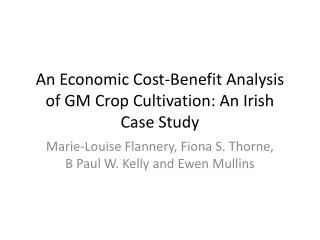
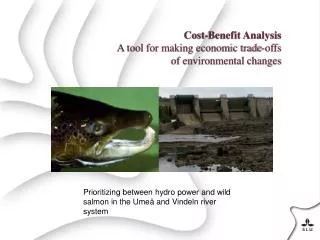
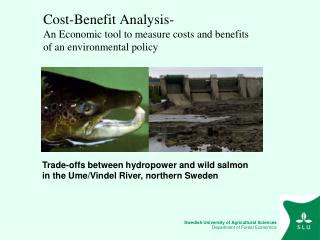
Cost-Benefit Analysis- An Economic tool to measure costs and benefits of an environmental policy. Cecilia Håkansson Department of Forest Economics SLU, Sweden. Trade-offs between hydropower and wild salmon in the Ume/Vindel River, northern Sweden. Article 5

E N D
Cost-Benefit Analysis-An Economic tool to measure costs and benefits of an environmental policy Cecilia Håkansson Department of Forest Economics SLU, Sweden Trade-offs between hydropower and wild salmon in the Ume/Vindel River, northern Sweden
Article 5 • Characteristics of the river basin district, review of the environmental impact of human activity and economic analysis of water use • 1. Each Member State shall ensure that for each river basin district or for the portion of an international river basin district falling within its territory: • an analysis of its characteristics, • a review of the impact of human activity on the status of surface waters and on groundwater, and • an economic analysis of water use • is undertaken according to the technical specifications set out in Annexes II and III and that it is completed at the latest four years after the date of entry into force of this Directive. • 2. The analyses and reviews mentioned under paragraph 1 shall be reviewed, and if necessary updated at the latest 13 years after the date of entry into force of this Directive and every six years thereafter. Introduction/Method/Empirical Exmple/Conclusions (2/21)
Why should an economic analysis be carried out? Efficiency The economic requirement is intendent to enable there to be a rational discussion on the cost-effectiveness of the various measures. Equity Decisions on the most appropriate measures to achieve the objectives in the river basin management plan will involve balancing the interest in various groups. The economic requirement is intendent to provide a rational basis for this discussion. Transparency The greater transparency in the establishment of objectives, the greater the care Member States will take to implement the legislation in good faith. Introduction/Method/Empirical Exmple/Conclusions (3/21)
Cost-Benefit Analysis-What is it and what kind of information can/should it provide? (1/3) Welfare improvement A Cost-Benefit Analysis (CBA) examines the consequences (costs and benefits) of an environmental policy in order to assess the relative merits of possible options. Cost-efficiency The option with the highest net benefit (benefits minus costs) is the most efficient. Environmental goods Evidently, a CBA should entail marketrelated as well as non-marketrelated costs and benefits. Introduction/Method/Empirical Exmple/Conclusions (4/21)
Cost-Benefit Analysis-What is it and what kind of information can/should it provide? (2/3) Equity It is not obvious how to deal with distributional issues when applying CBA. Transparency and Equity However, by shedding light on how environmental policy maps into consequences for different groups in the society we obtain a richer basis for making decisions. Introduction/Method/Empirical Exmple/Conclusions (5/21)
Cost-Benefit Analysis-What is it and what kind of information will/should it provide? (3/3) Transparency and Uncertainty A CBA should present the degree of uncertainty in the analysis that is due to that our understanding of the economic and ecological systems per se is limited. Perhaps more importantly, our understanding of the complex interplay between the economy and the environment is even more limited. In Summary A CBA provides decision-support information, rather than definite answers. Introduction/Method/Empirical Exmple/Conclusions (6/21)
Trade-offs between Hydropower and Wild Salmon inthe Ume/Vindel River Introduction/Method/Empirical Example/Conclusions (7/21)
Ume/Vindel River Introduction/Method/Empirical Example/Conclusions (8/21)
The lifecycle of Atlantic Salmon Introduction/Method/Empirical Example/Conclusions (9/21)
These wild salmon have their most important spawning sites c. 230 km upstream (data from Laxracet) 80 % Major Upstream problem: Stornorrfors Power station
Bypass channel (Old river bed) Rapids (Laxhoppet) Fish- ladder ”Laxhoppet” The Study area in the Ume River Minimumflow: Weekdays 20 m3/s Weekends 50 m3/s
Cost-Benefit Analysis • Project: Guarantee that a certain amount of salmon reach their spawning places each year. • Benefits: Increase of the wild salmon stock Non-market good Non-market valuation • Costs: Loss of electricity production Market good Introduction/Method/Empirical Example/Conclusions (12/21)
Non-market valuation Introduction/Method/Empirical Example/Conclusions (13/21)
Ecological Models (1/2) How much extra water needs to be allocated to the wild salmon? • Model: Predicted upstream migration success of salmon in the bypass channel at added bypass flows • River specific data: Turbine flow, flow in the bypass chanell, water temperature, sex of salmon, length of salmon and the salmon’s moving patterns in the river.
Ecological Models (2/2) For how many years do we need to allocate extra water to the wild salmon? • Model: Predicted number of salmon passing the fish ladder after improved upstream migration. • River specific data: The model is based on results from 1995-2005 of tracking radio-tagged upstream migration salmon in the Ume River, and 30 years of information from the fish ladder. • Other data: Data from International Council for the exploration of the Sea (ICES) (2000) Years after improvement
Results Total benefits: 96 MSEK- 517 MSEK Total costs: 114 MSEK- 2101 MSEK Net-benefits: -2005 MSEK- 403 MSEK Introduction/Method/Empirical Example/Conclusions (17/21)
Uncertainties • Benefit side • Valuation uncertainty • Cost side • Electricity price • Biological models Total Benefits Total Costs 0.25 SEK/kWh Total Costs 0.50 SEK/kWh Total Costs 1.00 SEK/kWh Total Costs 1.50 SEK/kWh Total Costs 0.25 SEK/kWh Introduction/Method/Empirical Example/Conclusions (18/21)
Among other things this cost-benefit analysis shed light on: Conclusions • the importance of including environmental costs and benefits that are not priced on a market in the analysis Efficiency • the presence of big economic and ecological uncertainties Transparency During the coming years we will investigate how costs and benefits are distributed between different groups. Equity Introduction/Method/Empirical Example/Conclusions (19/21)
According to the WFD’s requirements this issues have to be seriously evaluated… and… the programme of measures have to be developed accordingly to the outcomes of art.5 analysis. Introduction/Method/Empirical Example/Conclusions (20/21)
Table 1 Characteristics for Swedes depending on how often the respondents go angling a. Characteristics for the sample Swedes, i.e. women and men b. Characteristics for women respectively men in the sample Swedes * Only three observations. Introduction/Method/Empirical Example/Conclusions/End