Download
1 / 12
120 likes | 199 Vues
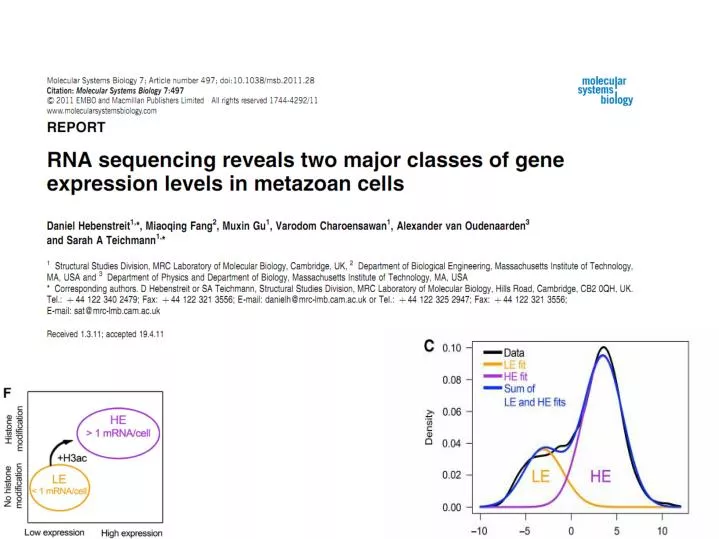
Claim. Genes are divided into two major overlapping expression classes – Lowly Expressed (LE) and Highly Expressed (HE) LEs are expressed (i.e., different from background noise) but at low levels

E N D
Claim • Genes are divided into two major overlapping expression classes – Lowly Expressed (LE) and Highly Expressed (HE) • LEs are expressed (i.e., different from background noise) but at low levels • This trend holds for all metazoan datasets tested, but is often obscured by mixing of cell types, lack of sensitivity in older arrays • Does not seem to hold for unicellular organisms
Background • Previous works argued for and against separation of genes into expression classes • The authors aim to make a definitive case that pure metazoan cell samples display two major abundance classes • They claim previous works showing absence of such classes were due to technical artifacts – lack of sensitivity, impure samples
2 RNA-Seq reps of Th2 cells & microarray data of same cell type Homogeneous population obtainable Expression levels highly correlated between techniques Calculated mean RPKM, log transformed
Use some function centered at each data point Contribution of each data point is one, then normalize all points together Typically use 'rule of thumb' for choice of bandwidth to avoid over/underfitting Kernel Density Estimates (KDEs)
AIC – Akaike [“ah-kah-ee-kay”] information criterion Compares between given choices of models AIC=2k-2ln(L); L output from EM, k number of components P Probability density p_k fraction of data in component p(x) Membership probability