1 / 1

Figure 7

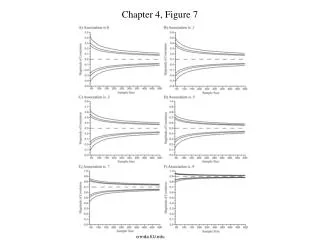
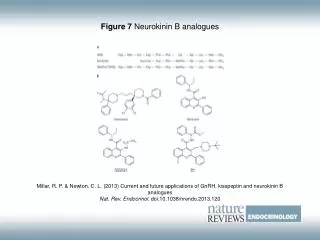
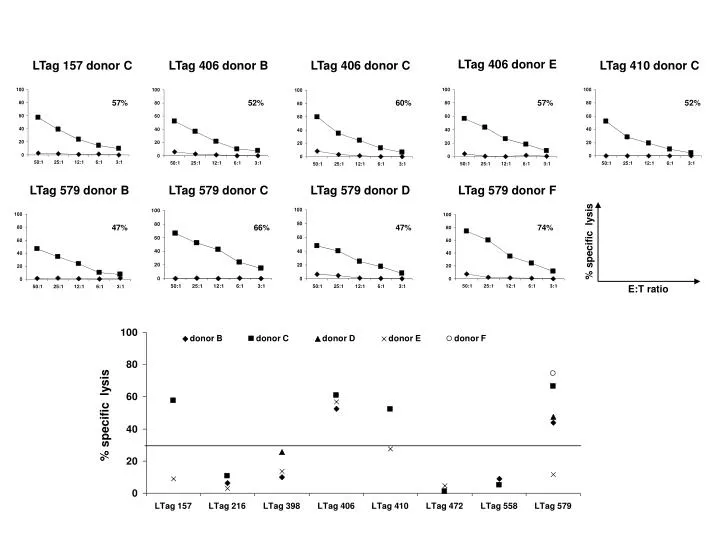
% specific lysis. Figure 7. LTag 406 donor E. LTag 157 donor C. LTag 406 donor B. LTag 406 donor C. LTag 410 donor C. 60%. 57%. 52%. 57%. 52%. LTag 579 donor B. LTag 579 donor C. LTag 579 donor D. LTag 579 donor F. % specific lysis. 66%. 47%. 74%. 47%. E:T ratio.

blue
Télécharger la présentation

Figure 7

An Image/Link below is provided (as is) to download presentation Download Policy: Content on the Website is provided to you AS IS for your information and personal use and may not be sold / licensed / shared on other websites without getting consent from its author. Content is provided to you AS IS for your information and personal use only. Download presentation by click this link. While downloading, if for some reason you are not able to download a presentation, the publisher may have deleted the file from their server. During download, if you can't get a presentation, the file might be deleted by the publisher.

E N D

Presentation Transcript


  1. % specific lysis Figure 7 LTag 406 donor E LTag 157 donor C LTag 406 donor B LTag 406 donor C LTag 410 donor C 60% 57% 52% 57% 52% LTag 579 donor B LTag 579 donor C LTag 579 donor D LTag 579 donor F % specific lysis 66% 47% 74% 47% E:T ratio

More Related