Download
1 / 30
300 likes | 479 Vues
New & Renewable Energy. PRESENTATION By. Agenda – I . Energy Scenario Power Reforms RE Imperative RE Scenario RE Policy Enablers RE Targets RE Investments Attractiveness. Energy Scenario. Power Capacity – 156 GW Thermal - 100 GW Hydro - 37 GW Renewable - 15 GW

E N D
New & Renewable Energy PRESENTATION By
Agenda – I • Energy Scenario • Power Reforms • RE Imperative • RE Scenario • RE Policy Enablers • RE Targets • RE Investments • Attractiveness
Energy Scenario Power Capacity – 156 GW Thermal - 100 GW Hydro - 37 GW Renewable - 15 GW Per Capita Consumption – 730 units RE Share in Generation – 4% Energy Served Population – 60% Peak Deficit – 12% Energy Deficit – 11% AT&C Losses – 30%
Power Reforms Unbundling of utilities De-licensing in Generation & Transmission Mega schemes - UMPP & UMTP Creation of National Grid Franchisee in Distribution Promoting merchant Power Focused approach for Rural Areas Promotion of Renewable Energy Fiscal & Financial Incentives RPO Targets National Solar Mission
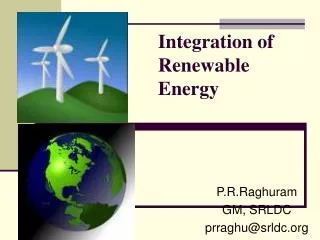
RE Imperative • Enormous RE potential • Promotes Energy Security • Promotes Sustainable Growth • Bridges demand-supply gap • Reduced Losses as Generation near consumption • Provides lifeline energy (Heat, Light & Power) to rural masses
Issues with RE Projects Remote Locations Infirm Power, difficult to schedule Limited Generation period, requires storage High Generation Cost due to High up-front cost Low Capacity Factor Under-utilization of transmission facilities Associated with Reactive Power First Generation Entrepreneurs Limited Public Sector Participation Lack of Trained Work-force
RE Policy Enablers Dedicated Ministry – MNRE Dedicated Financial Institution - IREDA Comprehensive Resource Assessment Wind Atlas Solar Radiation Mapping Identification of Hydro sites Enabling Legislations NAPCC Purchase Obligations Preferential Tariffs/ GBI/ RE Certificate Guaranteed off-take, Must-Run status
Fiscal & Financial Incentives Excise duty exemptions Income Tax Holiday Accelerated Depreciation Electricity Duty exemption Preferential Tariffs/ GBI/ RE Certificate Interest & Capital subsidies 100% FDI permitted Energy buy-back through long-term PPA Captive, 3rd Party Sale & Trading
Indian RE Scenario Note: Grid connected capacity as on 31-Oct-2009
2012 RE Targets & Investments (*) After deducting for the commissioned capacity as on 31 Oct’09 from MNRE-RFD for Wind, SHP & Biomass (**) Solar – JNNSM (Th-600 MW + PV-400 MW) (^) Cost projections – Inline with CERC guidelines
Indian Economy • Fastest growing free market democracy • 4th largest economy • GDP growth @ 8% • Infrastructure • 2nd largest Rail network • 334 airports • 12 major ports & 87 minor ports • 400 Million telephone connections • 5th largest power market • IT & Engineering Superpower
FDI in India 100% FDI allowed in power Generation, Transmission & Distribution Government has set up Foreign Investment Implementation Authority One-stop service to foreign investors Obtaining necessary approvals Sorting operational problems www.investinginindia.in
INDIA: Ideal Destination US$ 35 Billion FDI in 2008-09 Source: IBM-PLI – Global Investment Locations Database, GILD
Agenda – II • Introduction • Operational Areas • Financing Schemes • Resource Base • Performance Highlights • International Partnerships • Recognition
Evolution INCEPTION Incorporated under the Companies Act on 11th March, 1987 to promote, develop and extend financial assistance for Renewable Energy and Energy Efficiency/ Conservation Projects. OBJECTIVE Extend financial support to Renewable Energy, Energy Efficiency & Conservation projects MOTTO Energy For Ever
OperationalAreas Sectors being financed: Wind Small & Medium Hydro Biomass Power & Cogeneration Solar Waste to Energy EE & Conservation Bio Fuels/ Alternate Fuels Other Activities • Intermediary for providing financing facilities for various MNRE Schemes • Implementing Agency for GBI scheme
Financing Offerings Schemes Project Financing Equipment Financing Financing Through Intermediaries Terms Loan - 70% of Project Cost Interest -11.25% to 12.15% (based on credit rating) Repayment - Upto 13 Years New Initiatives Securitization against future receivables Structured repayment Loan syndication under Consortium Non-recourse financing
Outreach Registered & Head office – New Delhi Branch Offices – Chennai & Hyderabad Camp Offices – Kolkata & Ahmedabad Business Development Associates – 50 Nos MoU with PFC, PTC, IIFCL for joint financing Conducts Business Meets, Seminars, workshops Publishes IREDA News & Bulletin on EE
Cumulative Performance • No of Projects Sanctioned :1892 • Total Loan Sanctions :Rs.10,356 Cr • Loan Disbursements :Rs. 5,754 Cr • Sanctioned Power Capacity :3616 MW • Commissioned Capacity :1902 MW • Conventional Fuel Replacement :13L MTCR/Yr As on 31/03/2009
India’ RE PortfolioIREDA’ Share As on 31/03/2009
Highlights Unique FI Dedicated for RE Financing Specialized knowledge of RE & EE High Brand Equity Catalyzed market development leading to commercialization of RE Assisting in policy formulation Profit earning & dividend paying ISO 9001:2000 Certified Company Highest share in RE Financing - 13.5%
International Partnerships Lines of Credit Availed Govt of Netherlands, 1991 :18 Million Dutch Guilders World Bank (1st LoC), 1993 :$ 145 Million DANIDA, 1993 :$ 15 Million Asian Development Bank, 1997 :$ 100 Million KfW, Germany (1st LoC), 1999 :€ 61 Million World Bank (2nd LoC), 2001 :$ 110 Million KfW, Germany(2nd LoC), 2008 :€ 50 Million KfW, Germany (3rd LoC) :€ 19.9 Million Lines of Credit in Pipeline AFD (France) :€ 70 Million JICA (Japan) :$ 100 Million
Lender’s Perceptions ADB - IREDA has satisfactorily performed the operational and institutional responsibilities in accordance with the diverse objectives for which it was created. World Bank - IREDA is well motivated, active and has strong interest in incorporating environmental costs and benefits into economic analysis. KFW - despite its fairly young age, IREDA is an able and competent financial institution and has retained its financial strength through years of very rapid growth and in sectors with considerable technological and financial risks.
Recognition • Second Prize in Water Globe Award Category of the Energy Award 2002 presented at Linz, Austria. • World Climate Technology Award for the year 1999 by Climate Technology Initiative (CTI), France.