Download
1 / 33
350 likes | 1.31k Vues
Report Painter: More Advanced concepts. MINS 298C-04 ABAP/4 Fall 1998. Report Painter: More Advanced concepts. Copyright 1998- Gail Corbitt Contents of this file are for the exclusive use of the special MINS 298C class dealing with SAP software at CSU Chico

E N D
Report Painter: More Advanced concepts MINS 298C-04 ABAP/4 Fall 1998
Report Painter: More Advanced concepts Copyright 1998- Gail Corbitt Contents of this file are for the exclusive use of the special MINS 298C class dealing with SAP software at CSU Chico for the Fall 1998 semester. Any other use in either electronic or hardcopy form is prohibited without the express written permission of the author. This material is confidential. Do not share it with anyone not enrolled in the class. Lecture #2: Report Painter 2
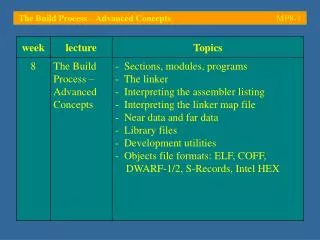
Report Painter: More Advanced concepts • Objectives: • Exploding Rows • Creating Libraries • Creating Models • Adding Text and other Layout Features • Performing Calculations • Finishing up Report Painter
Exploding Rows • Occurs when you have a Row Value that consists of more values • Example: Cost Center Codes 40000 - 43000 could be split out to individual codes or collapsed • Default is to NOT explode • To change this default: Edit --> Rows --> Explode
Exploding Report Rows Cost elements Actual Plan Var. Do not explode Total 30.000 20.000 10.000 Cost element group Cost elements Actual Plan Var. Total 400000 400100 * Group 1 600000 600100 * Group 2 ** Total 5.000 5.000 5.000 5.000 10.000 5.000 5.000 10.000 10.000 10.000 5.000 5.000 20.000 15.000 5.000 30.000 20.000 10.000 Explode 400000 400100 Group 1 600000 600100 Group 2 Cost elements Actual Plan Var. 400000 400100 600000 600100 5.000 5.000 5.000 5.000 10.000 10.000 10.000 5.000 5.000 Single values
Report Painter: Creating New Libraries • Library defines what objects (attributes of objects) can be included in it’s reports • Defines Selected: • Characteristics (attributes that are key fields) • Key Figures (types of “measures” or values -- typically numeric) • Pre-Defined Columns • Defined by SAP • Consist of Key Figures and Characteristics • Can Define Your own
Library A library contains: Report group C - Characteristics Report group B Report group A Criteria for selecting data records (cost element, version...) - Key figures Value fields in selected data records - content-related reports - Predefined columns Combinations of characteristics andkey figures
Report Painter: Creating New Libraries • Report Painter --> Report Writer --> Library --> Change • Copy and then Modify (Add and Delete attributes) • Create: Creates a custom library for your reports • Create a Library for your Reports • Report Painter --> Report Writer --> Library --> Create • Start name with a Z • Display Existing Libraries: • Report Painter --> Report Writer --> Library --> Display --> Utilities --> Catalog
Library Maintenance Characteristics Key figures Predef. columns Name Position Name Position Name Position X Controlling area X Cost center X Cost element X Order X Fiscal year X Period : : 1 2 3 4 5 6 X Costs X Quantity X Activity quantity X Stat. quantity X Costs in obj. currency X Variable costs : : 1 2 3 4 5 6 X Actual costs X Plan costs X Act. qty. current period X Act. activity fiscal year X Stat. quantity plan X Disp. activity fiscal year : : 1 2 3 4 5 6 LIBRARY : Z01 TABLE : CCSS Description: Cost Center Accounting Reports
Report Painter: Models • Model = Template • Sets of Rows OR Columns You May Want to Re-use • Models are Static: If you Change a Model you Must Change All Reports That Use the Model OR Have Reports with Different Versions of the Model • Report Painter --> Model --> Create • Use for column Definition: Within Report Definition: Edit --> Columns --> Get Column Model • Edit Rows -- > Get Row Model (for Rows)
Flexible Reports with Variables KOKRS GJAHR Controlling area &1KOKRE Fiscal year &1GJAHV - &1GJAHB Controlling area --------------from fiscal year --------------to fiscal year --------------from period --------------to period --------------Cost element group (set) -------------------------or value(s) ----- ----- ? ? PERBL KSTAR Period &1PERIV - &1PERIB ? ? CostElement & 1KSTAR Resulting selection screen:
Using Variables in Report Painter • Variable: Defined Parameter that Users fill in at Run Time • Year, Starting Period and Ending Period, etc. for the Data • Types of Variables: • Value: single Value such as Controlling Area, Company Code, Work Center, Plant, etc. • Formula: Rolling Periods or Previous June with This June • Set: Set up groups that corresponds to the way the data are structured. For example, Groups in CO can be used as a Set Parameter • Find parameter ID through technical info in field definition
Value Variables Variable 1PERIV Field name PERBL Default value 1 Description from period Table CCSS Use parameter ID Entry: Characteristic values Controlling area: 001 Fiscal year: 1996 to Period: 1PERIV to 1PERIB Cost center: to or group 1KOSET
MILLER Formula Variables Default values from the system 1. Current year? 2. Previous year? Formula variable 1GJAHLJ: System exit that determines the current fiscal year from the controlling area and the fiscal year variant. Formula variable 1GJAHVJ: Internal variable that determines the previous year 1GJAHVJ = 1GJAHLJ - 1
Variables for Groups (Set Variables) Entry: Characteristic values Variable 1KOSET Field name KOSTL Reference set 1-S-KOSTL-AL Description Cost center group Table CCSS Controlling area: 0001 Fiscal year: 1996 to Period: 1PERIV to 1PERIB Cost center: to or group 1KOSET
Adding Blocks and Sections • Block: Columns that are grouped together • Example: Sales report in $ by Product vs Quantity by Product • Row Structure is identical for all column blocks • Menu Path: Go To --> New Column Block • Section: Rows that are grouped together • Example: Planned and Actual Costs by Cost Center and by Product Group • Column Structure is identical for all row blocks • Menu Path: Go To --> New Section
Sections Example Cost elements Actual Plan Var. 400000 400100 : Section 1 Activity types Actual Plan Var. Direct labor hours Direct repair hours : Section 2 Stat. key figures Actual Plan Employee Telephone costs : Section 3
Column Blocks Example Column block 1: Costs Column block 2: Quantities Cost elem. Act. costs Plan costs Var. Cost elem. Act. qty Plan qty. Var. 400000 . . . . . . . . . 400100 . . . . . . . . . 400200 . . . . . . . . . : : : : * Total . . . . . . . . . 400000 . . . . . . . . . 400100 . . . . . . . . . 400200 . . . . . . . . . : : : : * Total . . . . . . . . . identical row structure
Adding Text to a Report • Types of Text • Title page • Header (top of every page) • Footer (foot of every page) • Last Page • Entering Text • Menu Path: Extras --> Report Text • Enter directly • Can also use variables, parameters, characteristics, etc.
Entering Text Standard variables Report name: < > Page: < > for example Report name Page number Date of selection Author of report Library description ...... From period: < > To period: < > Fiscal year : < > Cost center: < > Person responsible: < > Selection parameters for example From period (value) To period (value) Fiscal year (value) .... Characteristics Special variables for example Controlling area Cost center for example, person responsible for the cost center
Standard Layouts • Standard layouts used in many companies so all reports have same look and feel • Basically a Corporate Template for reports • Define a Standard in layouts • Menu Path: Report Writer --> Standard layout --> Create • Attach a layout to a report by displaying it -- this is used for the report you are working on • Defaults provided by SAP (see drop down list)
--------- --------- --------- --------- Layout Settings Column width No. format +/- sign Text type Cost element Level of detail Color Overscore and underscore 4200 Salaries . . . . . . . . . . . . . . . . 4300 Wages . . . . . . . . . . . . . . . . 4400 Add. costs . . . . . . . . . . . . . . . . *Total . . . . . . . . . . . . . . . .
Standard Layout Report Definition Standard Layout: TRAINING Column totals Totals position Column break left none right line Other characterLayoutColumn widthRight marginUnit width 1 to 5 3 characters Other value Variants 1 to 5Column textsText type Alignment Miscellaneous Master data text Left-justified Suppress zero columns Field value and text Centered Underline col. break Field name and fld value Right-justified character Field value Suppress X X X X X
Calculations in Report Painter • Cells are given Z values as you click on cells you want to use for calculations • Suppress Rows and Columns that you want to use for calculations but don’t want to show Z001 Z002
Costs Act. Plan Act. per employee Stat. key figures Actual Plan Employee Telephone units Cell Z001 Cells in Formula Columns Section 1 Key figure withcharacteristics Predefined column Formula Formula: X001 / Z001 Section 2 Z001 Employee / actual X001 Actual costs X002 Plan costs
Calculation Using Cells Section 1: Costs Section 2: Stat. actual key figures Plan Actual Act./Empl. Plan Actual Telephoneunits Employee Total Section 3: Important statistics Plan Actual Costs / Employee Telephone units / Employee
Costs Actual Plan Var. Stat. key figures Actual Plan ............. Employee ............. Telephone costs ............. ............. Cell Z002 ............. Total Cell Z001 Z001 Actual Plan Costs per employee Z002 Sections with Calculated Key Figures Section 1 Section 2 Formula: Z001 / Z002 Section 3 Costs / Actual Employee / Act.
Suppressed Rows and Columns Debit previous year (Period 1 - 13) Debit current year (Period 1 - 4) Total debit (Column 1 + Column 2) Order 1000 1.000 500 1.500 2000 4.000 1.000 5.000 3000 700 300 1.000 4000 2.000 2.000 4.000 suppressed columns
Additional Considerations • Variation: Allows you to run the same report at detail or summary level determined at run time • Define the Variation function in Report Definition under General Data Selection • At Run time push variation button and select the desired variation level • Execute the Report Group • Multiple Selection: Run the same report but separate every time by variable, I.e. Cost Center
CoArea from 0001 to 0002 (or set) FYear from 1992 to 1993(or set) Multiple Selection CoArea 0001FYear 1992 CoArea 0001 FYear 1993 CoArea 0002 FYear 1992 CoArea 0002 FYear 1993 Example Reports to be output 1 4 combinations 2 3 4
Hierarchy S02000 S02000 ENERGY Multiple Selection (continued) Fixed Hierarchy Selected groupsX " " S02000 1 Area report" " X all sets 5 Reports" " " " only basic sets S02110, S02120, S02200 3 Reports(or value(s) from . . .to) S02000 Warehouse -2210 Electricity -2220 Water -2230 Gas S02110 Warehouse1 S02120 Warehouse2
S02000 S02000 Warehouse S02000 ENERGY Variation -2240 Electricity -2250 Water -2260 Gas S02120 Warehouse 2 S02110 Warehouse 1 - 2210 Incoming warehouse - 2220 Outgoing warehouse - 2230 Semi-finished product Variation Explode Do not explode Single values
Leveraging Existing Reports • Run a Report in SAP • Extras --> Display Definition • Extras --> Technical Info (drill down on Program name) • Shows you ABAP code • Copy from these reports and then modify • When you create the report use Options --> Copy From