Download
1 / 33
330 likes | 514 Vues
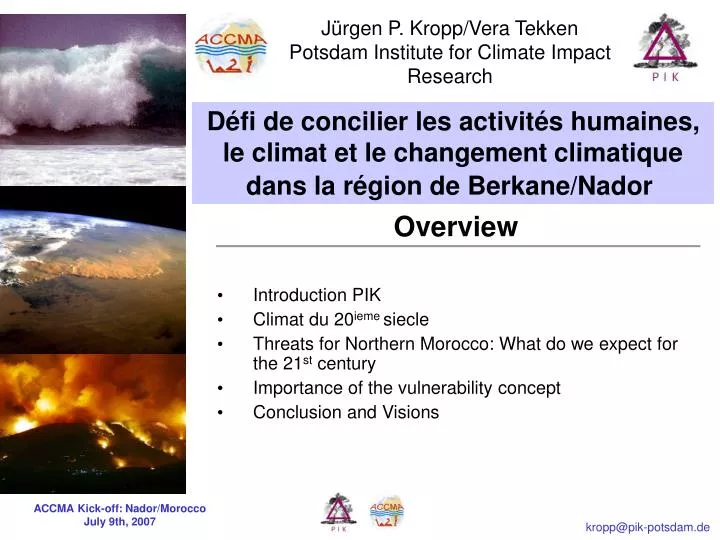
Défi de concilier les activités humaines, le climat et le changement climatique dans la région de Berkane/Nador . Jürgen P. Kropp/Vera Tekken Potsdam Institute for Climate Impact Research. Overview. Introduction PIK Climat du 20 ieme siecle

E N D
Défi de concilier les activités humaines, le climat et le changement climatique dans la région de Berkane/Nador Jürgen P. Kropp/Vera TekkenPotsdam Institute for Climate Impact Research Overview • Introduction PIK • Climat du 20ieme siecle • Threats for Northern Morocco: What do we expect for the 21st century • Importance of the vulnerability concept • Conclusion and Visions kropp@pik-potsdam.de
A few words about PIK kropp@pik-potsdam.de
Potsdam Telegraphenberg Geo-Research Centre Alfred Wegner Centre for Polar Research Süring-Building Potsdam Institute for Climate Impact Research Michelson-Building Helmert Tower Great Refractor Max Planck Institute for Astrophysics Library Einstein-Tower kropp@pik-potsdam.de
Research Area 1: Earth system analysis Research Area 2: Climate Impact & Vulnerability Research Area 3: Sustainable Solutions Research Area 4: Transdisziplinary Concepts & Methods kropp@pik-potsdam.de
Advice for German Chancellor A. Merkel Conference of the G8+5 environmental ministers at PIK British-German Climate Conference in Berlin, opened by the British Queen Policy advice on all levels..... kropp@pik-potsdam.de
What implies Climate Change? U.S. Bureau of the Census Mackenzie et al (2002) Richards (1991), WRI (1990) Reid & Miller (1989) NOAA FAO • Global-scale changes that affect the functioning of the Earth System • Much more than climate change • Socio-economic as well as biophysical For example, changes in: kropp@pik-potsdam.de
Learn from earth‘s history: atmospheric CO2 concentration We are here! * Holocene Eem Weichselian +350 Kyrs. CO2 concentration/temperature for the last „700.000 years“ (orbital, solar forcing) CO2 average for glacials: 185 ppm CO2 average for interglacials: 280 ppm Today 383ppm (CO2 equiv. 400ppm) > 35% higher than the value for interglacials and the highest since 700 kyrs!) Epica ice cores 2004 kropp@pik-potsdam.de
What have we observed duringthe 20th century? kropp@pik-potsdam.de
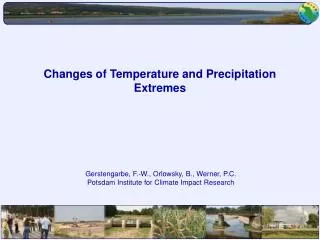
Difference Annual Sum Preciptation: 1901/1930 vs. 1971/2000 [mm] minus 10 – 100 mm: Al Hoceima/Nador/Berkane up to 50 mm plus south of the Atlas mountains up to 0-50 mm plus central north (Meknes/Fes) kropp@pik-potsdam.de
More detailed proneness: % years with precipitation < 400 mm (1981-1998) More details Vera‘s talk! kropp@pik-potsdam.de
Difference Air Temperature: 1901/1930 vs. 1971/2000 [°C] 0.6 – 1.0 °C in Morocco kropp@pik-potsdam.de
The Complex Climate System Obviously quite well understood (climate & weather), but what remains uncertain? kropp@pik-potsdam.de
It‘s the anthropogenic forcing, but we are already on the way to the future......... A2: heterogeneous world, economic growth local oriented, welfare gap remains, population growth up to ~15 bn, 2100 (worst case) Stabilization: < 450ppm Emission reduction: > 50% B1: rapid introduction of resource-efficient technologies, north-south equity, focus on global solutions, stable population ~7 bn, 2100 (sustainable) IPCC 2007 kropp@pik-potsdam.de
Summary of the IPCC scenarios IPCC 2007, WGI kropp@pik-potsdam.de
What can we anticipate for the 21st century? kropp@pik-potsdam.de
precipitation annuelle (A2)What different models say! CGCM2 HadCM3 PCM Green: unchanged Red: dryer Blue: wetter High model coincidence! Average decrease of >150mm by 2100 is very likely! kropp@pik-potsdam.de
Seasonal changes: precipitation (A2/HadCM3)difference 2000 vs. 2100 winter spring decrease: 50 - 150 mm [+60, -70] mm fall [+50, -80] mm blue: wetter in 2100 red: dryer in 2100 Green: unchanged Summer: overall decrease kropp@pik-potsdam.de
Temperature change (A2/HadCM3)difference 2000 vs. 2100 hotter +[3.5, 6]°C Seasonal: Summer: +[4, 7]°C Winter: +[2.5, 4]°C unch. Diffenbaugh et al. 2007 Alexander et al. 2006 Obs. 6d period/top10% Tmax kropp@pik-potsdam.de
Identifying vulnerable sectors and regionsPrecondition for the development of management/steering alternatives! The Endeavour for Morocco, i.e. Nador/Berkane kropp@pik-potsdam.de
CLIMATE CHANGE Human Interference - Stocktaking - Reduction Initial Impacts Effects MITIGATION (global) Responses IMPACTS VULNERABILITIES VULNERABILITIES Residual or Net Impacts Planned ADAPTATION (local) dangerous? vulnerable? Policy Responses kropp@pik-potsdam.de
Vulnerability Concept Vulnerability: The degree to which a „system“ is susceptible to adverse effects of climate change impacts. Vulnerability is a function of the character, magnitude, and rate of climate variation to which a system is exposed (exposed system), its sensitivity (degree of interference), and its adaptive capacity (capability to adjust). Example: Vulnerabilty of North-Rhine Westphaliaagainst weather extremes 396 counties, area: 34070 km2 (9.5% of total) 18 Mio. inhabitants (22.5% of total), 22% of total GDP Since climate change impacts may cause serious consequences in several sectors it can reduce societies‘ ability to respond! Thus vulnerability is a concept allowing to identify hot-spots of action and is one precondition for adaptation! kropp@pik-potsdam.de
Sectoral vulnerability NRW (>24 indicators, 1998) Cyclone Kyrill 2007 loss of 19 Mio. m3 wood forest sector (tree type composition, hill slope) heatwaves (population density, amount of elderly people) local employment market (seasonal unemployment) Source: Kropp et al. 2006, Climatic Change kropp@pik-potsdam.de
Social Vulnerability: Climate Related Disasters Data: www.em-dat.net • Drought • Extreme Temperature • Flood • Wave / Surge • Slides • Wild Fires Climate sensitivity= + 60,000 per 1°C per Mio. people kropp@pik-potsdam.de
Are the Morrocan coasts threatened? kropp@pik-potsdam.de
Threat of Sea Level Rise Divergence: observations/considerations after Archer 2006 observations considered in AR4 1900-2000: 1-2 mm/yr -- 1961-2003: 1.8 mm/yr 1.2 mm/yr 1993-2003: 3.1mm/yr 2.6 mm/yr ...we are not in an equilibrium, on longer time scales (e.g. 2300, 3ºC): will be much higher: 2.5-5.1m (WBGU 2006) kropp@pik-potsdam.de
Coastal VulnerabilityRisks & Costs of Sea Level Rise DINAS Coast 2004 Coastal Protection Targets Current track: A2 Normative: 100yrs Normative: 75yrs Sustainable track: B1 BAU: B1 BAU: A2 kropp@pik-potsdam.de
Main Assumptions & Calculations Costs without adaptation Costs with protection target Normative Protection Level: 100 u. 75yr return level Comparison: with business as usual (BAU: leave all as it is!) Failure mode: overtop breach mode Migration allowed: yes Simulation time: 5yrs, time spam 2000-2100 Input forcing scenarios: A2 and B1 Cost calculation for the coast of Morocco: kropp@pik-potsdam.de
Cost Calculations: BAU vs. Protection Target A2 worst until 2060 until 2035 B1 best Kick-off investments for 100yr protection target Overall: Benefits! Losses kropp@pik-potsdam.de
DTM Nador/Berkane Horizontal 90m Vertikal 1 m Sea Level Rise: risk prone areas below 1m Wind pressure/direction will cause additional Threats, e.g. wave tide! kropp@pik-potsdam.de
Digital Terrain Model Marsa Ben Mehdi/Saidia vertical 1m horizontal 90m Risk prone area below 1m kropp@pik-potsdam.de
DTM Lagoon of Nador vertical 1m horizontal 90m Risk prone area below 1m kropp@pik-potsdam.de
Marocco will face threats, i.e. learn to manage the unavoidable, cope with SLR, water scarcity, etc...., but avoid unmanageable situations! Increased social and biophysical vulnerability; i.e. seek for alternatives in employment, agriculture, tourism... • (One) Vision: use Moroccos • natural resource: solar power! • as basis for development • for sea-water desalinisation • energy supplier for Europe • benefit from joint implement. Mandatory for Morocco kropp@pik-potsdam.de
Panoramic Analysis of Problems Scientific Advisory Board to the Government can help to meet the transsectoral challenges! Thank you for your attention! kropp@pik-potsdam.de