Download
1 / 72
740 likes | 964 Vues
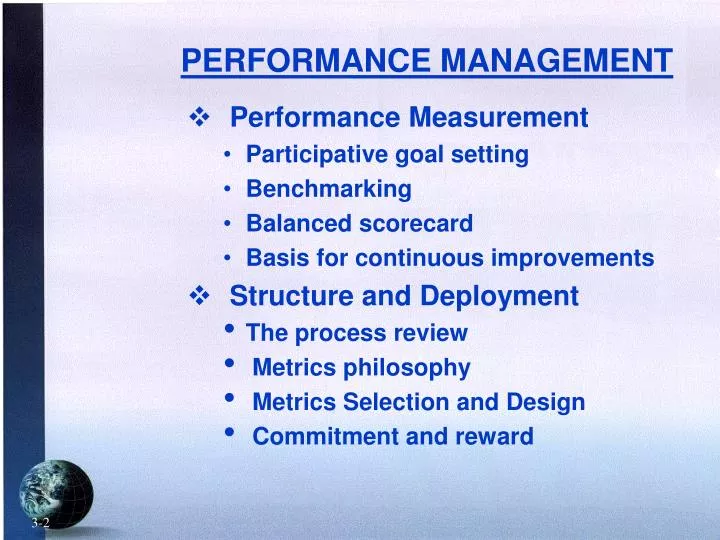
PERFORMANCE MANAGEMENT. Performance Measurement Participative goal setting Benchmarking Balanced scorecard Basis for continuous improvements Structure and Deployment The process review Metrics philosophy Metrics Selection and Design Commitment and reward. 3-2.

E N D
PERFORMANCE MANAGEMENT • Performance Measurement • Participative goal setting • Benchmarking • Balanced scorecard • Basis for continuous improvements • Structure and Deployment • The process review • Metrics philosophy • Metrics Selection and Design • Commitment and reward 3-2
WHY PERFORMANCE MEASUREMENT • Management By Facts • “Without data, you're just another opinion.” SELECT PROBLEM PARETO DIAGRAM HISTORGRAM SCRAP REWORK ANALIZE PROBLEM DATA COLLECTION ID ROOT CAUSE C & E DIAGRAM CHECK SHEET CONTROL CHARTS GRAPH SCATTER DIAGRAM PLAN & X ACTIONS CONFIRM RESULTS BEFORE AFTER FINE TUNE ACTION 1 ACTION 2 TIME 3-3
WHY PERFORMANCE MEASUREMENT • Establish Foundation for Continuous Improvement • Identify and size critical customer complaints • Research and track world class performance • Establish world class benchmarks • Create relevant performance measurements • Establish performance tracking and reporting • Equate customer perception to reality • Equate Customer Perception to Reality • Always use historical data when meeting with customers 3-4
WHY PERFORMANCE MEASUREMENT • A Basis for Achievement Recognition and Reward Annual Personal Performance Recognition Lessons Learned Quarterly Team Achievement Award Monthly Individual Achievement Award Weekly Individual Achievement Award Best-to-Date Celebration 3- 5
PERORMANCE MANAGEMENT • The Where and What of the Balanced Scorecard Timely Product Development Timely Materials Availability On-Time Prod’n and Shipments Inventory Effectiveness Yes Yes Yes Yes Engineering Documentation Review Forecast and Master Schedule Review Linearity and Resource Review Receiving and Stock/Issue Review No No No No Total Customer Satisfaction Excellent Internal Quality Valid Material Costs Timely Direct Labor Availability Yes Yes Yes Feedback and Corrective Action Review Cost of Quality Review Cost Accounting Review Resource and Capacity Review No No No No 3-6
PERFORMANCE MANAGEMENT • The “Balanced Scorecard” Sales/Service Engineering 1. Build Release Timing 1. ECN Accuracy 2. S.O. Accuracy 2. Engrg Quality 3. SER Response 3. SER Execution 4. Customer Samples 4. Warranty Expense 5. On-site Startup 5. Equip. Reliability Operations Finance 1. Production Linearity 1. Accounts Receivable 2. On-time Delivery 2. Accounts Payable 3. Product Quality 3. CODs and Checks 4. Supplier Performance 4 Information Integrity 5. ECN Execution 5. Inventory Utilization Cascading measurements with aggregate performance roll-up 3-7
THE BALANCED SCORECARD • The Ten Period Rolling Method Annual Personal Performance Recognition Quarterly Team Achievement Rewards Lessons Learned Weekly Performance Incentives Best-to-date Celebrations 3-8
THE BALANCED SCORECARD • Six Critical “Must Dos” • 1.KISS! Simplicity is important - complete understanding is necessary - start slow and let it grow • 2. Negotiations are required and agreements are crucial • 3. The number isn’t important, direction is the best focus • 4. Tenacity is everything - good measurements should never die and never fade away • 5. Timing is paramount - for example: financial data is too aggregate and way too late • 6. Target selections - cascading structure is good, but performance analysis is best 3-9
MAINTAINING SYSTEM CREDIBILITY • Establishing a Measurement Mindset “THERE IS NO STATUS QUO! YOU’RE EITHER WINNING OR YOU’RE LOSING” There is no effective control without measurements! 3-10
MAINTAINING SYSTEM CREDIBILITY • Databases, Ownership and Maintenance • 1. Simple Department Processes- Sales Order Input • - User: process owner • - Database: chalk board, tick chart and hand plot graphs • - Maintenance: process customer • 2. Complicated Department Processes - On-time Delivery • - Users: process owner or team • - Database: Excel spreadsheet and computer graphs • - Maintenance: assigned team member • 3. Intradepartmental Processes - Cost of Quality • - User: functional manager or self-directed process team • - Databases: computerized business systems down • loaded to Access for additional input forms and graphs • - Maintenance: MIS and/or team data specialist • Remember, “Without data, you're just another opinion.” 3-11
MAINTAINING SYSTEM CREDIBILITY • Some Requisites for Success • Management acceptance and support • A few good champions • Trust and understanding • Valid, timely and consistent measurements • Need to review and adjust range of metrics • Demonstrated benefits from use of system • A “want to succeed” business culture • A true sense of accomplishment 3-12
BENCHMARKING • Internal - A Good Starting Place • Define critical company success factors • Identify relevant work processes and prioritize by importance • Identify process owners and internal customers • Agree on current performance levels and establish data measurements • Negotiate improvement goals - celebrate the goal achievements and reset the marks 3-13
BENCHMARKING • External - Some of the Options • Customers • Non-Competitive Businesses • Competitors • American Electronics Association • American Production & Inventory Society • Society of Manufacturing Engineers • Purchasing Management Association • American Management Association • Institute of Quality and Productivity -SDSU • Your Best Option: Industry Week - Benchmarking Tool Kit - www.industryweek.com 3-14
BENCHMARKING • Internal - The Line on the Wall Story Lessons Learned 100 Engines on the Floor 3-15
BENCHMARKING • Internal - The Line on the Wall Story Lessons Learned 100 Engines on the Floor 3-16
INFORMATION INTEGRITY • Objectives • Accuracy • Timely availability • Ready accessibility • Ease of understanding • Targets • Engineering Documentation • Systems Data • Work Instructions • Work Standards 1-2
Lessons Learned INFOTEGRITY 1-3
Lessons Learned SALES FORECAST Up/Down Cycle, Product Management PURGING THE DEADBEATS Target GPM 1-4
SALES FORECAST Field Sales Data - Credibility Reviews The Annual Forecast - SWAG Field Sales Management Review The Quarterly Forecast SBs and WTs Inside Sales Review Funnel Report Production Planning Team Review Build Plan 1-5
SALES FORECAST Forecast-Master Schedule Decision Process 1-6
Lessons Learned ENGINEERING DOCUMENTATION Cost and Speed of Product Development 1-7
ENGINEERING DOCUMENTATION Timely Availability % Availability DETAILED PARTS DRAWINGS % Availability ASSY DRAWINGS DESIGN PROTO PROD’N DESIGN PROTO PROD’N TIME TIME WORK INSTRUCTIONS TEST SPECIFICATIONS DESIGN PROTO PROD’N DESIGN PROTO PROD’N 1-8
ENGINEERING DOCUMENTATION • Release and Change Control Process • Engineering has design ownership • Manufacturing has implementation ownership • Block change concept • The obsolete ECR-CCB-ECO process • The “World Class Design Team” • Concurrent engineering concept • Conceptual design buy-off gate • Project management and design reviews • Design focus - do it right the first time • Prototype and Beta design buy-off gates • Up front design for manufacturing 1-9
SYSTEMS EFFECTIVENESS Infotegrity Controls 1-10
Lessons Learned SYSTEMS EFFECTIVENESS 1-11
SYSTEMS EFFECTIVENESS • Visual Management • Sequential production • Point of use logistics • Everything has a place and is in its place • The “constraints” board • Trouble lights • Kanbans • Time phased schedules • Cycle time and GPM displays • The daily walk around 1-12
INFOTEGRITY CONTROLS The Effectiveness Curve 1-13
INFOTEGRITY CONTROLS Lessons Learned Audits, Tracking and Corrective Actions INVENTORY RECORD ACCURACY 1. TOP 20 2. Negative Balances 3. 100%ers 4. Average Count 5. Average Net $ 6. Average Absolute $ 7. Location INVENTORY PROBLEMS AND CORRECTIVE ACTIONS WK REOCCURRENCES No. PROBLEM CORRECTIVE ACTIONS Who WK53 WK54 WK55 WK56 “Four blanks and you’re Off” 1-14
INFOTEGRITY CONTROLS The “Where, What, and Why of Controls Timely Product Development Timely Materials Availability On-Time Prod’n and Shipments Inventory Effectiveness Yes Yes Yes Yes Engineering Documentation Controls Forecast and Master Schedule Controls Linearity and Resource Controls Receiving and Stock/Issue Controls No No No No Total Customer Satisfaction Excellent Internal Quality Valid Material Costs Timely Direct Labor Availability Yes Yes Yes Feedback and Corrective Action Controls Cost of Quality Controls Cost Accounting Controls Resource and Capacity Controls No No No No 1-15
ACCURACY AND TIMING • Sales Forecasts • Up/down cycle, product management • Field sales data - input credibility reviews • Forecast-Master Schedule decision process • Engineering Documentation • Cost and speed of product development • Timely availability • Release and change control process • Systems Effectiveness • KISS • Management controls • Visual management • Infotegrity Controls • The effectiveness curve • Audits, tracking and corrective actions • The where, what and why of controls 1-16
STRUCTURE AND DEPLOYMENT The Methodology • The process review • Metrics philosophy • Metrics Selection and Design • Commitment and reward Benefits • A focus on critical success targets • Establishes process ownership • Relevant innovation and learning • Bottom Line Results 6 -2
THE PROCESS REVIEW The Business Survey Credible Sales Forecasting Timely Product Development On-Time Prod’n and Shipments As Received Quality Yes Yes Yes Yes Forecast and Master Schedule Process Review Engineering Documentation Process Review Materials and Scheduling Process Review Mini-ISO-9000 Quality Process Review No No No No Strategic Planning Total Customer Satisfaction Inventory Effectiveness Profit Margins Yes Yes Yes Strategic Plan Review Feedback and Proactive Process Review Days of Supply Process Review Cost of Quality and Kaizen Process Review No No No 6 -3
THE PROCESS REVIEW • In Search of Constraints/Opportunities Credible Sales Forecasting Constraints/Opportunities 1. Untimely forecast updating 2. Sandbagging and SWAGing 3. Lack of credibility analysis 4. No formal forecasting process No Sales Forecast & Master Schedule Process Review 6 -4
THE PROCESS REVIEW In Search of Constraints/Opportunities Timely Product Development Constraints/Opportunities 1. Bill of material errors 2. Late drawing releases 3. Excessive engineering changes 4. Ineffective product design process No Engineering Documentation Process Review 6 -5
THE PROCESS REVIEW In Search of Constraints/Opportunities On-Time Production and Shipments Constraints/Opportunities 1. Poor supply chain performance 2. Ineffective MRP system 3. Excessive inside-of-lead-time orders 4. Worker inflexibility No Materials and Scheduling Process Review 6 -6
THE PROCESS REVIEW In Search of Constraints/Opportunities As Received Quality Constraints/Opportunities 1. Lack of worker training 2. Poor supply chain performance 3. Inadequate work instructions 4. Poor general quality attitude No Mini-ISO-9000 Quality Process Review 6 -7
THE PROCESS REVIEW In Search of Constraints/Opportunities Product Profit Margins Constraints/Opportunities 1. Excessive scrap and rework 2. Poor supply chain performance 3. No continuous improvement program 4. Too much overtime No Financial and Cost of Quality Process Review 6 -8
THE PROCESS REVIEW In Search of Constraints/Opportunities Inventory Effectiveness Constraints/Opportunities 1. Little line item accountability 2. Excessive work-in-process 3. No inventory parameter maintenance 4. Poor record accuracy No Days of Supply Process Review 6 -9
THE PROCESS REVIEW In Search of Constraints/Opportunities Total Customer Satisfaction Constraints/Opportunities 1. Lack of sales/service feedback 2. Limited customer communication 3. Untimely inquiry response times 4. No corrective action logs/history No Feedback and Proactive Process Review 6 -10
THE PROCESS REVIEW In Search of Constraints/Opportunities Strategic Planning Constraints/Opportunities 1. Too little down the chain communication 2. Little low level commitment 3. Ineffective benchmarking 4. No relevant tactical plan or execution No Company Performance Review 6 -11
THE PROCESS REVIEW Selection of a Few Relevant Metrics Company 1. Gross profit margin 2. Customer satisfaction index 3. Sales revenue 4 New product introduction cycle 5. Productivity (Sales per employee) 6 -12 Top Level measurements
THE PROCESS REVIEW Selection of a Few Relevant Metrics Sales 1. Missed sales opportunities 2. Inside of lead-time bookings 3. Sales order entry errors 4. Open customer complaints 5. Customer order cycle time 6 -13 Cascading measurements with aggregate performance roll-up
THE PROCESS REVIEW Selection of a Few Relevant Metrics Customer Service 1. Past due delivery dates 2. Open corrective action items 3. On-site equipment MTBF 4. Open “Request for Quotations” 5. Warrantee Expenses 6 -14 Cascading measurements with aggregate performance roll-up
THE PROCESS REVIEW Selection of a Few Relevant Metrics Engineering 1. Bill of material errors 2. Late engineering releases 3. Routing and planning errors 4 Product design cycle times 5. Sales information cycle times 6 -15 Cascading measurements with aggregate performance roll-up
THE PROCESS REVIEW Selection of a Few Relevant Metrics Operations 1. Non-Linear carry-overs 2. Build cycle times 3. As delivered quality problems 4. Supplier line rejects 5. Product cost-of-sales 6 -16 Cascading measurements with aggregate performance roll-up
METRIC PHILOSOPHY A Focus on Improvement Example #1: 6 -17
METRIC PHILOSOPHY A Focus on Accomplishment Example #2: 6 -18
METRICS PHILOSOPHY Keep It Simple Stupid (KISS) • Easily understood • Controllable by team actions • Reliable and true • Traceable to a source Make Sure it Provides • A number that you can quantify and graph • Useful feedback • An aggressive target • A team’s ability to influence the outcome • A relationship to critical success targets 6 -19
METRICS RECORDING Scorecard Template Design Lessons Learned 6 -20
METRICS RECORDING Ten Periods Cascading Lessons Learned 6 -21