Download
1 / 1
10 likes | 171 Vues
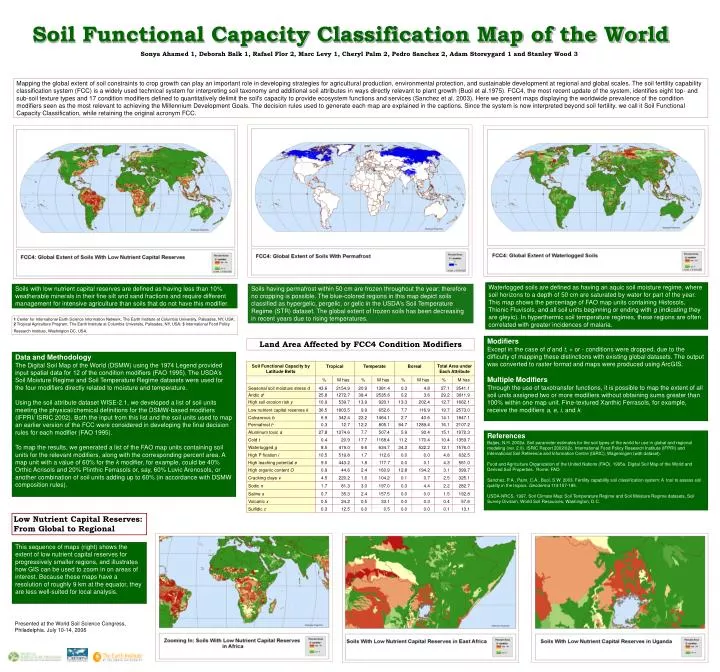
Sonya Ahamed 1, Deborah Balk 1, Rafael Flor 2, Marc Levy 1, Cheryl Palm 2, Pedro Sanchez 2, Adam Storeygard 1 and Stanley Wood 3.

E N D
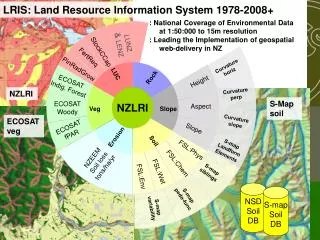
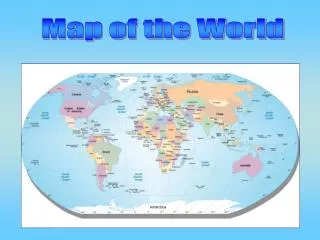
Sonya Ahamed 1, Deborah Balk 1, Rafael Flor 2, Marc Levy 1, Cheryl Palm 2, Pedro Sanchez 2, Adam Storeygard 1 and Stanley Wood 3 Mapping the global extent of soil constraints to crop growth can play an important role in developing strategies for agricultural production, environmental protection, and sustainable development at regional and global scales. The soil fertility capability classification system (FCC) is a widely used technical system for interpreting soil taxonomy and additional soil attributes in ways directly relevant to plant growth (Buol et al.1975). FCC4, the most recent update of the system, identifies eight top- and sub-soil texture types and 17 condition modifiers defined to quantitatively delimit the soil's capacity to provide ecosystem functions and services (Sanchez et al. 2003). Here we present maps displaying the worldwide prevalence of the condition modifiers seen as the most relevant to achieving the Millennium Development Goals. The decision rules used to generate each map are explained in the captions. Since the system is now interpreted beyond soil fertility, we call it Soil Functional Capacity Classification, while retaining the original acronym FCC. Soil Functional Capacity Classification Map of the World Waterlogged soils are defined as having an aquic soil moisture regime, where soil horizons to a depth of 50 cm are saturated by water for part of the year. This map shows the percentage of FAO map units containing Histosols, Thionic Fluvisols, and all soil units beginning or ending with g (indicating they are gleyic). In hyperthermic soil temperature regimes, these regions are often correlated with greater incidences of malaria. Waterlogged soils are defined as having an aquic soil moisture regime, where soil horizons to a depth of 50 cm are saturated by water. This map shows the percentage of FAO map units containing Histosols, Thionic Fluvisols, and all soil units beginning or ending with 'g' (indicating they are gleyic). In hyperthermic soil temperature regimes, these regions are often correlated with greater incidences of malaria. Soils with low nutrient capital reserves are defined as having less than 10% weatherable minerals in their fine silt and sand fractions and require different management for intensive agriculture than soils that do not have this modifier. Soils having permafrost within 50 cm are frozen throughout the year; therefore no cropping is possible. The blue-colored regions in this map depict soils classified as hypergelic, pergelic, or gelic in the USDA's Soil Temperature Regime (STR) dataset. The global extent of frozen soils has been decreasing in recent years due to rising temperatures. 1 Center for International Earth Science Information Network, The Earth Institute at Columbia University, Palisades, NY, USA; 2 Tropical Agriculture Program, The Earth Institute at Columbia University, Palisades, NY, USA; 3 International Food Policy Research Institute, Washington DC, USA. Modifiers Except in the case of d and t, + or - conditions were dropped, due to the difficulty of mapping these distinctions with existing global datasets. The output was converted to raster format and maps were produced using ArcGIS. Multiple Modifiers Through the use of taxotransfer functions, it is possible to map the extent of all soil units assigned two or more modifiers without obtaining sums greater than 100% within one map unit. Fine-textured Xanthic Ferrasols, for example, receive the modifiers a, e, i, and k. Land Area Affected by FCC4 Condition Modifiers Data and Methodology The Digital Soil Map of the World (DSMW) using the 1974 Legend provided input spatial data for 12 of the condition modifiers (FAO 1995). The USDA’s Soil Moisture Regime and Soil Temperature Regime datasets were used for the four modifiers directly related to moisture and temperature. Using the soil attribute dataset WISE-2.1, we developed a list of soil units meeting the physical/chemical definitions for the DSMW-based modifiers (IFPRI/ ISRIC 2002). Both the input from this list and the soil units used to map an earlier version of the FCC were considered in developing the final decision rules for each modifier (FAO 1995). To map the results, we generated a list of the FAO map units containing soil units for the relevant modifiers, along with the corresponding percent area. A map unit with a value of 60% for the k modifier, for example, could be 40% Orthic Acrisols and 20% Plinthic Ferrasols or, say, 60% Luvic Arenosols, or another combination of soil units adding up to 60% (in accordance with DSMW composition rules). References Batjes, N.H. 2002a. Soil parameter estimates for the soil types of the world for use in global and regional modeling (ver. 2.0). ISRIC Report 2002/02c, International Food Policy Research Institute (IFPRI) and International Soil Reference and Information Centre (ISRIC), Wageningen (with dataset). Food and Agriculture Organization of the United Nations (FAO). 1995a. Digital Soil Map of the World and Derived Soil Properties. Rome: FAO. Sanchez, P.A., Palm, C.A., Buol, S.W. 2003. Fertility capability soil classification system: A tool to assess soil quality in the tropics. Geoderma 114:157-185. USDA-NRCS. 1997. Soil Climate Map: Soil Temperature Regime and Soil Moisture Regime datasets, Soil Survey Division, World Soil Resources, Washington, D.C. Low Nutrient Capital Reserves: From Global to Regional This sequence of maps (right) shows the extent of low nutrient capital reserves for progressively smaller regions, and illustrates how GIS can be used to zoom in on areas of interest. Because these maps have a resolution of roughly 9 km at the equator, they are less well-suited for local analysis. Presented at the World Soil Science Congress, Philadelphia, July 10-14, 2006