Download
1 / 26
270 likes | 483 Vues
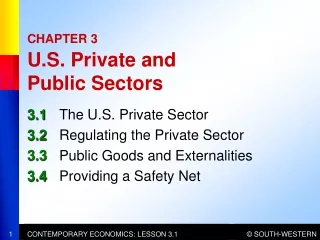
4. The U.S. Economy: Public and Private Sectors. Chapter Objectives. Important Facts About U.S. Households and U.S. Businesses Corporate Form Domination in Sales and Profits Principle and Agent Issues Economic Role of Government in the Economy

E N D
4 The U.S. Economy: Public and Private Sectors
Chapter Objectives • Important Facts About U.S. Households and U.S. Businesses • Corporate Form Domination in Sales and Profits • Principle and Agent Issues • Economic Role of Government in the Economy • Categories of Government Spending and the Sources of Government Revenues
Households as Income Receivers Functional Distribution of Income-2005 National Income Received (Percent) 0 10 20 30 40 50 60 70 71% Wages & Salaries 1% Rents Income By Function Performed 5% Interest 9% Proprietor’s Income 14% Corporate Profits Source: Bureau of Economic Analysis
Households as Income Receivers Personal Distribution of Income-2004 Personal Income Received (Percent) 0 10 20 30 40 50 60 Lowest 20% 3.4% Second 20% 8.7% Income Group (Households) Middle 20% 14.7% 23.2% Fourth 20% 50.1% Highest 20% Source: Bureau of the Census
Households as Spenders Household Uses of Income-2005 Household Income Expended (Percent) 0 10 20 30 40 50 60 70 80 90 12% Personal Taxes 0% Personal Saving Income Group (Households) 88% Personal Consumption Consumption Divided Between… Composition of Consumption 29% 12% 59% Services Nondurable Goods Durable Goods Source: Bureau of Economic Analysis
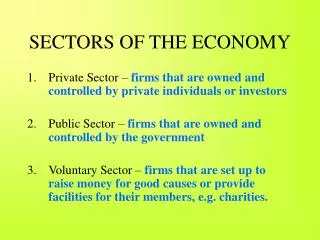
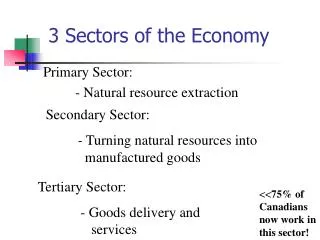
The Business Population • Plant • Firm • Industry • Multiplant Firms • Vertically Integrated • Conglomerates
Legal Forms of Business • Sole Proprietorship • Partnership • Corporation Domestic Output by Business Type 20% Corporations Partnerships 8% 84% Corporations 72% Sole Proprietorships 11% Partnerships 5% Sole Proprietorships Percentage of Firms Percentage of Sales Source: U. S. Census Bureau
O 4.1 Legal Forms of Business Advantages of Corporations • Corporate Securities • Stock • Bond • Limited Liability • Hiring of Specialists • Unlimited Lifetime • Principal-Agent Problem
GLOBAL PERSPECTIVE Legal Forms of Business World’s 10 Largest Corporations 1- ExxonMobil (US) 2- Wal-Mart (US) 3- Shell (UK/Netherlands) 4- BP (UK) 5- General Motors (US) 6- Chevron (US) 7- Ford Motor (US) 8- DaimlerChrysler (Germany) 9- Toyota (Japan) 10- ConocoPhillips (US) $328 Billion 312 Billion 307 Billion 249 Billion 193 Billion 185 Billion 178 Billion 177 Billion 173 Billion 162 Billion Source: Fortune
The Public Sector: Government’s Role • Providing the Legal Structure • Maintaining Competition • Monopoly • Regulation • Regulated Monopolies • Antitrust Laws • Sherman Act 1890
O 4.2 The Public Sector: Government’s Role • Redistributing Income • Transfer Payments • Market Intervention • Taxation • Reallocating Resources • Market Failure • Externalities or Spillovers • Negative or Positive Types
The Public Sector: Government’s Role • Correcting for Negative Externalities • Legislation • Specific Taxes • Correcting for Positive Externalities • Subsidize Consumers • Subsidize Suppliers • Provide Goods Via Government
The Public Sector: Government’s Role • Public Goods and Services • Private Goods • Rivalry • Excludability • Public Goods • Nonrivalry • Nonexcludability • Free-Rider Problem • Quasi-Public Goods • The Reallocation Process
The Public Sector: Government’s Role • Promoting Stability • Unemployment • Inflation • Government’s Role: A Qualification • Political Context • Overregulation • Underregulation • Benefits and Costs • Not Perfectly Carried Out
The Circular Flow Revisited Resource Market Money Income Costs Input Factors Resources Expenditures Resources Goods & Services Goods & Services Businesses Government Households Net Taxes Net Taxes Goods & Services Expenditures Goods & Services Goods & Services Product Market Consumption Revenue
Government Finance • Government Purchases • Government Transfers 35 30 25 20 15 10 5 0 Government Transfer Payments 31% 27% 12% 5% Percentage of U.S. Output 22% 19% Government Purchases 1960 2005
GLOBAL PERSPECTIVE Government Finance Total Tax Revenue – Selected Nations Percent of Total Output-2004 10 20 30 40 50 Sweden Denmark Norway Finland France Italy United Kingdom Germany Canada Australia United States Japan South Korea 50.7 49.6 44.9 44.3 43.7 42.2 36.1 34.6 33.0 31.6 25.4 25.3 24.6 Source: Organization for Economic Cooperation and Development
Federal Finance Federal Expenditures-2005 Four Stand-Out Areas of Spending 0 10 20 30 40 50 Pensions & Income Security 35% 21% Health National Defense 20% Interest on the Public Debt 7% Source: U. S. Office of Management and Budget
W 4.1 Federal Finance Federal Tax Revenues-2005 • Progressive Tax Rates • Brackets of Income • Marginal Tax Rate • Average Tax Rate
Federal Finance Federal Tax Revenues-2005 Basic Revenue Sources 0 10 20 30 40 50 Personal Income Tax 43% Payroll Taxes 37% Corporate Income Taxes 13% Excise Taxes 3% All Other 4% Source: U. S. Office of Management and Budget
State and Local Finance State Finances • Primary Revenues • Sales & Excise Taxes - 48% • Personal Income Taxes - 34% • Corporate Income Taxes & License Fees – Most of Balance • Primary Expenditures • Education – 35% • Public Welfare – 28% • Health & Hospitals – 7% • Highways – 7% • Public Safety – 4% • Other – 19%
State and Local Finance Local Finances • Primary Revenues • Property Taxes – 73% • Sales & Excise Taxes – 17% • Primary Expenditures • Education – 44% • Welfare, Health & Hospitals – 12% • Public Safety – 11% • Housing, Parks, & Sewers – 8% • Streets & Highways – 5%
Financing Social Security Last Word • Demographic Changes • Severe Long-Run Shortfall in Social Security Funding • Annual Pay-as-You-Go Plan • Impact of Baby Boomer Retirements • 2017 Revenues Less Than Payments – Trust Fund Withdrawals • Trust Fund Exhausted in 2040 • Possible Benefit Reductions and Tax Revenue Increases
Financing Social Security Last Word • Possible Solutions • Stock & Bond Investments • Payroll Tax Increases • Individually Directed Accounts for Annuity Incomes Owned by Government • Half of Payroll Deduction in Privately Owned and Managed Accounts – Phased in Over Time • Consensus Solution to be Very Difficult
functional distribution of income personal distribution of income durable goods nondurable goods services plant firm industry sole proprietorship partnership corporation stock bond limited liability principal-agent problem monopoly externality negative externalities positive externalities public goods free-rider problem quasi-public goods government purchases transfer payments personal income tax marginal tax rate average tax rate payroll taxes corporate income tax sales and excise taxes property taxes Key Terms
Next Chapter Preview… The United States in the Global Economy Chapter 5!!!