Download
1 / 67
670 likes | 672 Vues
Progress report on the integration of GIS and scenarios for optimum water management in Wadi Zeimar and Alexander River. Analysis of past, present, and future scenarios and cost-benefit estimations.

E N D
Wadi Zeimar – Alexander River Progress report OPTIMA Optimisation for Sustainable Water Management Gumpoldskirchen, Austria, May 18-19, 2006
OPTIMA – 4rd Board MeetingWadi Zeimar – Alexander river Progress report Nir Becker Eran Friedler Marwan Haddad Nancy Rumman Research assistant: Aviad Kahana
Outline • Background • Integration • GIS presentation • Scenarios • Benefit estimation • 2005 scenario results • Cooperation
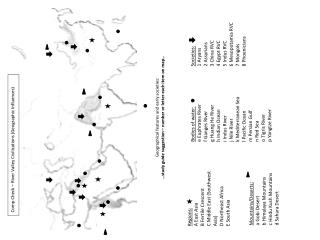
Introduction: Alexander - Zeimar Catchment - Orientation Map
The Test case: Alexander - Zeimar River The River runs for about 44 km from the western side of the Mountain Belt across cultivated areas and past towns of the Coastal Plain to the Mediterranean Sea.
202 197 192 187 182 5 km 177 136 141 146 151 156 161 166 171 Tulkarem Natania Kalanswa Taibe Tira Nablus Kochav Yair
Schematic Representation of Wadi Zeimar Area Green Line Tulkarem catchment Approximate Catchment Boundary Anabta catchment Sabastya catchment Nablus catchment
GIS Contribution Based on data from: • The meteorological central station • The geological institute • The ministry of Agriculture • The national center for mapping
Alexander - Zeimar Catchment 1930 - 1960 Data source: Israel Meteorological Service
Scenarios • River at 1995 • River at 2005 • Cost benefit Analysis of existing situation • Look into the future: Cost effectiveness analysis of a prespecified benefit target • W/O cooperation • With cooperation
Benefit Estimation • Travel Cost Model • Contingent Valuation Model
TCM • 300 surveys at the site (Dec. 2005 – March. 2006) • Used to estimate only Use-value. Only 2005 situation. • We used two sub-models • Zonal travel cost • Individual travel cost (will not be described here but was done).
Step 3 (cont.) Total benefit of the site: (MNIS per year) Linear function: Visits =65577-157.32*(Travel Cost) TB=15,471,164 Cubistic function: Visits = 96554.5 – 796.7*TC + 2.3 (TC)2 – 0.0022 (TC)3 TB=10,268,534 Exponential function: Visits =[6.504756-ln(Travel Cost)]/0.00008426 Travel Cost =668.3*exp{-0.00008426*(Visits)} TB=7,929,665
CVM (In process) 300 surveys (200 at the site + 100 sample of general effected population) Payment card Can estimate Use + nonuse values Can estimate future hypothetical scenarios - We asked about future water quality improvement which can be thought of as almost usable for every purpose
Later Possible future scenarios
Technical/Technological Treatment Options and Site Selection: IL
Zeimar – Alexander basin The comparison between the years 1995 – 2005 focuses primarily on the four following points: Many secondary pollution sources were eliminated Natanya’s wastewater treatment facility Kubani Creek Wadi Zeimar.
General Features – (changes in river perception): A quick look at the two models shows that in 2005 the river was used by fewer points (sources of both water and pollution) than in 1995. In 1995, Alexander River was thought of mainly as a “waste sink” – an easy way to dispose of wastes, both liquid and solid. In 2005, the river was hoped to be restored to its natural condition for recreational use 1995 2005
Natanya’s Wastewater Treatment Plant: 1995 These plant treat the wastewater of Natanya (population: 146,000 people in 1995). The plants had a direct effect on our point of interest, Turtle Bridge. The large amount of water diluted most of the pollutants that were carried by the current. Turtle Bridge 1E4 5E3 Values were taken from this reach FLOW: 12 MCM/year. DO: 0 mg/l B.O.D: 50-60 mg/l F.coli: 10000 CFU/100ml
Natanya’s Wastewater Treatment Plants: 2005 As of 1999, this source stopped discharging treated wastewater into the river. Today this water is instead used for agricultural irrigation. Therefore, there is no contribution to the river from this point. Turtle bridge
Kubani Creek: 1995 This creek used to collect wastewater from 4 towns and 2 factories into a sedimentation pond. The waste was then moved to a waste reservoir and from there to the main river. In reality, the ponds and the reservoir were not maintained and their capacity was only 5-10% of its original plan. This meant that most of the flow went straight into the river year round. -The fish farm contributes water to the creek once a year, which in 1995 was not considered to be a major problem. Turtle Bridge 1E7 Values were taken from this reach 5E6
Kubani Creek: 2005 • Today the 4 towns and 2 factories are separated from the creek. Now the creek collects only runoff, and its flow is calculated using the RRM model. • The fish ponds are now considered to be the only pollution point in the creek. This pollution occurs once a year – for a week long period – at the end of December, when the ponds recycle their water back into the creek. Turtle bridge
Zeimar : 1995 Zeimar stream gets waste from Nablus, Sabastya, Anabta and Tul-Karem. This contains waste from industries, stone sawmills, solid wastes, leather factories, garages and more. In addition, for two months every year (October-December) olive waste is released into the stream from approximately 26 olive mills that are spread along the stream. Ten months out of every year, the color of the water is white, due to the stone powder in it. For two months every year, the water is black, due to the organic matter in the olive waste. In 1995, the total amount of flow from Zeimar Stream was 1.5-2 MCM. Turtle bridge CFU/L 1E7 5E6
Zeimar: 2005 In 2002, a treatment plant was built to take all of the flow (~10MCM) that runs through Zeimar Stream (not including floods). This treatment plant removes the solid waste, stone powder, sawdust, sand and oils from the water. The water is then stored in a Reservoir that is used as an extensive treatment facility (flow in=flow out). The water is released back into the main stream in a much better quality, although still not meeting the water quality standard that is needed to restore it to its natural condition. In the time of the olive harvest, the facility does not work. Instead, there is an “Emergency Solution”. Turtle bridge 1E5 5E4