Download
1 / 35
360 likes | 363 Vues
Cette présentation donnera probablement lieu à des discussions d ' où ressortiront des propositions d ' action. Utilisez PowerPoint pour noter ces actions au cours de la présentation. En mode Diaporama, cliquez avec le bouton droit de la souris. Cliquez sur Aide-mémoire.

E N D
Cette présentation donnera probablement lieu à des discussions d'où ressortiront des propositions d'action. Utilisez PowerPoint pour noter ces actions au cours de la présentation. • En mode Diaporama, cliquez avec le bouton droit de la souris. • Cliquez sur Aide-mémoire. • Cliquez sur l'onglet Liste d'actions. • Tapez les actions à mesure qu'elles sont proposées. • Cliquez sur OK pour fermer la boîte de dialogue. • Une diapositive Liste d'actions sera automatiquement créée à la fin de votre présentation. Thème 121 « Transport services and networks » ORATE – ESPON Lead partner: Ph Mathis University of Tours
Espon 121 final report • Main maps and their interpretation • Key policy recommendations • Main scientific achievements • Short evaluation of the networking activities (inside and outside the project) • Proposals for further research and improvement of the data availability
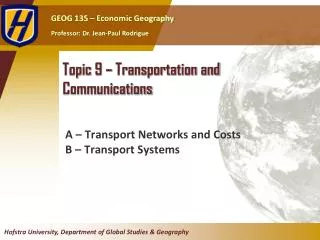
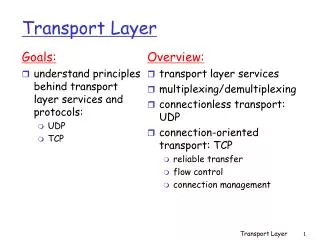
Main maps and their interpretation Endowment: Infrastructure supply - infrastructure capacity - service vulnerability Traffics: Volume - flow Accessibility: Cost - Daily accessibility - Potential accessibility Innovative mapping approaches: Time space maps - crumpled time-space maps and crumpled cost maps
Major territorial imbalances (1) In the European space, the first imbalance is geographical The geographical constraints influenced the settlement The territory is not compact Transit space is limited The mountains zones are barriers but the maritime transport potential is important
Major territorial imbalances (2) The centre-periphery organization (with either a pentagon or “blue banana” structure) Moreover, there are other differentiations and finally very contrasted Space becomes a very rare resource for countries with high density of population The low densities attract the tourism and the settlement growth on the littoral The modification of these imbalances seems hardly possible currently
Hierarchy of the road network according to the size of cities linked
Fractal dimension by country For the main road network
Cartogram of population by NUTS 2 and main road corridors and weak links
Time-space map: The shrinking continent
Cost to motorways by car
Cost to rail stations
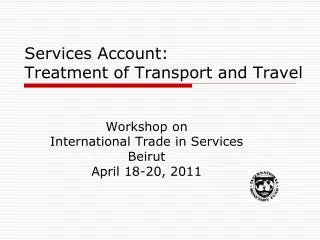
Cost to commercial seaports by car
Roro traffic of major ports Unequal repartition of gateways
Potential freight flows between and old EU members in 2019 Enlargment contributes to change the direction of the exchanges, from a north-south domination to an east-west one
Transport externalities for transit Nox emissions for trucks
From road networks to cities networks The "potential Polycentrism of proximity”, as is showed by the map below for a criterion of distance of 100 km
Multimodal potential accessibility
City network’ daily accessibility by air
Accessibility and GDP per capita in NUTS-3 regions
Global policy recommendations Each modification induces imbalances. Imbalance is inseparable of the dynamic. The increase of the capacities of road corridors is currently impossible for most of highways Moreover, the capacities available on the railways are insufficient to permit a modal shift In our domain, dynamic can be seen as a confrontation between two different temporalities. The temporality of the transport supply that is expressed in the easiest way by creations of road and rail infrastructures (13 to 15 years) The temporality of the transport demand that is those of firms for goods and that is roughly of 3 or 5 years, for the creation of a production unit and for a relocation We propose to promote policies at short, medium, and long term
Key policy recommendations at the European level Global short term transport policy recommendations, already in application in numerous agglomerations: • regulation of traffics to increase the capacities, diminish the pollutants, the casualties… • pricing policies, • development of intermodality to facilitate a modal shift and • the degradation of speeds on roads Towards a sustainable transport: a reduction of the fuel consummation, so of the emission, of casualties, etc…
Key policy recommendations at the European level Global medium term transport policy recommendations Support the modal shift with maritime transport Presently, in conditions of concurrency really less favourable, rail transport is only competitive from 500 to 700 km. Transformation of classical railways into freight-dedicated lines: to support the need of modern logistics, proposal for high speed and high frequencies rail freight transport (150 km/h: 1000 km in 8 hours)
Key policy recommendations at the European level Global long term transport policy recommendations A policy of creation of new infrastructures is also necessary: we must diminish the vulnerability of network by • a minimum of modal redundancy when it is possible and • a multimodal redundancy when it is not
Key policy recommendations at the European level Zonal policy recommendations: • Atlantic Arc area • Mediterranean Sea area • Nordic area • Central area • Eastern Europe Findings of the indicators Priority transport projects Policy recommendations
Policy recommendations for the Atlantic area
Policy recommendations for the Mediterranean area Corridors Gateways
Policy recommendations for the Nordic area
Policy recommendations for the central area
Policy recommendations for the eastern area
Main scientific achievements • 5 research teams, 47 indicators, 89 maps • Extension of existing indicators • Development of many new indicators • Promoting other types of maps: nodes, networks, multi-scales, time-space • A common framework for the presentation of indicators • From transport indicators to policy recommendations • Confrontation of indicators: the variety of the points of views, ie the accessibility
Networking in the ESPON ESPON Project 1.2.1 is very well integrated Networking within ESPON took place : at the level of project co-ordinators, the level of National Focal Points, the level of overall networking at ESPON Seminars the level of bilateral contacts to other TPG the level of involvement of project partners in numerous other ESPON projects relevant for 1.2.1. Exchanges on data issues, concepts, indicators and typologies were sought with a number of projects, in particular with 1.1.1, 2.1.1 and 3.1
Perspectives for further researches Structures (territories, networks, transport modes) will face deep changes Classical econometric model for forecast can not be applied: based on present trends and constant structure, they can only show amplified or reduced existing trend New prospective models must be developed: To do this, we can use numerous new techniques: percolation, cellular, Multi-agent system… This model must take the European special networks into account to test various scenarii in the short and long term.