Download
1 / 13
130 likes | 285 Vues
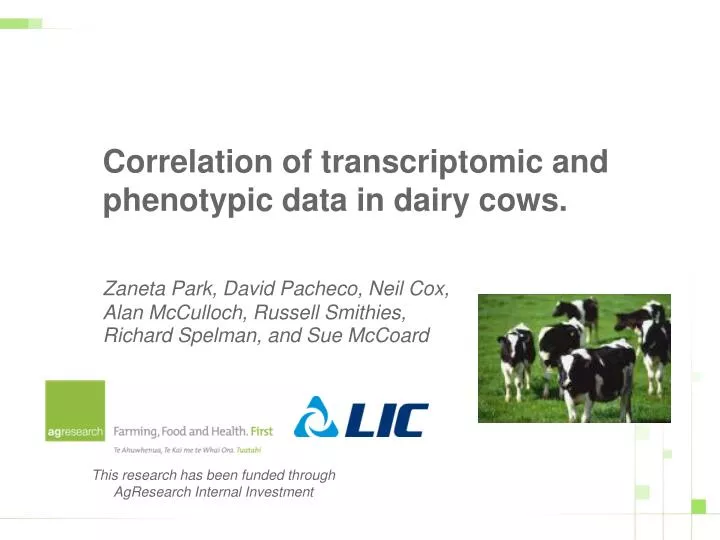
Correlation of transcriptomic and phenotypic data in dairy cows. Zaneta Park, David Pacheco, Neil Cox, Alan McCulloch, Russell Smithies, Richard Spelman , and Sue McCoard. This research has been funded through AgResearch Internal Investment. The data….

E N D
Correlation of transcriptomic and phenotypic data in dairy cows. Zaneta Park, David Pacheco, Neil Cox, Alan McCulloch, Russell Smithies, Richard Spelman, and Sue McCoard This research has been funded through AgResearch Internal Investment
The data… • An awesome data set as both gene expression and phenotypic data available for ~ 350 dairy cows. • Our objective was to determine if any genes had expression that was significantly correlated with any of the phenotypes. • Essentially a data-mining exercise, however because of the large number of samples, it seemed likely that any such correlations would truly represent an association between the gene and phenotype.
Affymetrix microarray data… • Fat and liver samples taken by biopsy • Run on an Affymetrix Bovine genome chip comprising 24128 genes • Data normalized using Robust multi-chip averaging (RMA) • ‘Present’, ‘Marginal’ and ‘Absent’ calls calculated for each gene on each chip. Only ‘Present’ genes used in further analyses. • Data log-transformed
Phenotypic data… • Data for 13 phenotypic variables was available: Milk yield and composition Endocrine: these variables also log-transformed Somatic cell count
Data cleaning… • Size of dataset allowed us the luxury of subsetting it to the very best data … thus increasing our chances of finding interesting, real correlations. • For example: • Only cows with phenotypic data recorded within +/- 2 days of the fat and liver biopsies were used to make sure that the relationship between the gene expression and phenotype data was as strong as possible. • Only cows biopsied on day 28 post calving were used, to minimize variability in the dataset due to stage of lactation. • Only cows that were milked twice daily through the season were used to minimize potential variability in the dataset due to frequency of milking effects.
Data cleaning (cont)… • Additionally, the phenotype data was plotted and cows with unusual values were excluded [e.g. cows with mastitis] • Outliers were also detected using • Excel filters… • …and the Min-Max summaries at the bottom of the spreadsheet. These are also useful for detecting skewed data. • After subsetting the data to the required high quality data, 121 cows still remained • Min = 0 Max = 1760 Average = 110
Data analysis… • R used to do the analyses • Raw microarray data files = 630MB!! • Linux used to run the analyses as Windows did not have enough memory! • PuTTY used to access Linux server from my Windows machine. = a terminal emulator i.e. provides a ‘window’ to the Linux server. • Xming is another tool for accessing a Linux server from your desktop. Has the advantage that also includes a graphics window.
Correlation analysis: gene expression versus phenotype… • Interested in finding genes which changed in expression with phenotype. • Started with a simple correlation analysis: Pearson correlations between all phenotype and gene combinations determined, using two FOR loops in R. • Number of combinations to test: 24128 genes x (13+4) phenotypesx 2 sample types = 820,352! • Using linux, R handled this comfortably in < 1 hour
Correlation analysis: results… • Significantly correlated genes defined as: p-value < 0.05; fold change for 90th versus 10th percentile > 1.2; number of “Present” genes>100 • Numbers looked reasonable: • Included 7 fat and 19 livergenes in the mTOR signalling pathway, which was within the bounds of expectation
Visualization of the results… • Difficult to graphically show the results for 820,352gene-phenotype combinations at once! • However, can use Excel tools and functions to make it easy to plot the relationship for any gene-phenotype combination… • Drop-down boxes using Data>Validation • MATCH • OFFSET
Visualization of the results… Use MATCH to determine where the chosen gene and phenotype occur in the data Gene/Phenotype data Type in the name of the gene to plot Use OFFSET and the MATCH result to obtain the data for the required gene and phenotype Select the phenotype from the drop-down list – this list created using Data>Validation
Summary… • Many good looking correlations seen • Visually, sire effects don’t appear to be large, however currently testing this using mixed effects regression. • Having such a large dataset is an extremely valuable resource to NZ