Download
1 / 48
480 likes | 680 Vues
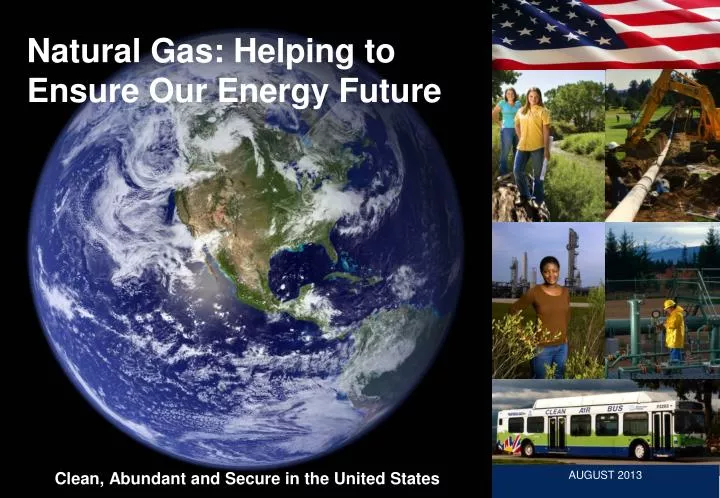
Natural Gas: Helping to Ensure Our Energy Future. Clean, Abundant and Secure in the United States. AUGUST 2013. Why Natural Gas? Why Now?. Why Natural Gas? Proven contributor to economy, environment and energy security Jobs and economic growth

E N D
Natural Gas: Helping to Ensure Our Energy Future Clean, Abundant and Secure in the United States AUGUST 2013
Why Natural Gas? Why Now? • Why Natural Gas? Proven contributor to economy, environment and energy security • Jobs and economic growth • Creates nearly 3 million jobs – direct and indirect – resulting in $180 billion in labor income between 2005 - 2010 • Contributes to economy – over $3.5 billion per year average in government revenues between 2005 and 2010 • Contributes to global competitiveness • Environmental benefits • Low emissions • Small land footprint • Sustainable • Essential to complement renewable energy sources • Domestic energy security • More than a 100-year supply and growing • Why Now? Abundant, secure and domestic • Huge untapped shale gas resource newly unleashed by innovation and technology
2001 to 2013 - A Decade Makes a Difference Then Now • 60-year supply and falling • Shale known but uneconomic to develop • Underground gas storage primarily traditional reservoir, operationally not very flexible • Pipeline capacity growing incrementally • Rising prices with several spikes • 100+ years supply and growing • Flourishing production, vast shale resources now accessible • Storage boom with more flexible salt-cavern facilities and additional market area storage • 16,000+ miles of interstate pipeline added since 2000 • Plentiful supplies moderate prices and provide supply diversity #
More Than 100-Year Supply • Estimates are always evolving and usually growing with improvements in technology. • If the 1966 estimate of 600 trillion cubic feet (Tcf) had remained static, the U.S. would have run out of natural gas about 10 years ago. • Estimates fall on the conservative side: history shows us there is more to be discovered.
How The Game Has Changed • Improvements in technology brought down costs and greatly increased the scope of resource development • Shale gas production quadrupled between 2006 – 2012 and is poised to comprise more than 40% of U.S. gas production in 2020 • Shale and other “unconventional’ gases could account for over 80% of U.S. gas production by 2020, compared to 66% today • Diversity of supply complements strong and growing pipeline system, reduces vulnerability to hurricanes, brings natural gas closer to consumers Gas Production by Type Through 2040 Source: EIA Annual Energy Outlook 2013
Technology Makes It All Work • Drilling technology improvements and efficiencies in shale have emerged • Longer horizontal laterals • Multiple-stage hydraulic fractures per lateral • Small surface footprint for multiple, extended wells • Horizontal drilling and hydraulic fracturing result in gas wells with long stable production lives • Ground water is separated by thousands of feet and tons of impermeable rock and protected by state and federal regulation • Significant amount of water is recycled • “Micro-seismic” technology evolving and enabling even greater precision in fracturing wells Source: American Petroleum Institute
Abundant Unconventional Gas Widespread Across U.S.U.S. Gas Reserves Increased 22% between 2006 – 2009 Primarily Due to Shale Development Source: Energy Information Administration based on data from published studies Updated: May 2011
Government Oversight of Natural Gas Production Regulated by states and under the following federal laws: • Clean Water Act – surface water discharge, storm water runoff • Clean Air Act – air emissions associated with processing equipment and engines • Safe Drinking Water Act – underground injection disposal/reuse of produced water and flowback fluids • Federal Land Policy and Management Act – permitting for federal onshore resources • Outer Continental Shelf Lands Act – permitting for federal offshore resources • National Environmental Policy Act – permits and environmental impact statements • Occupational Safety and Health Act – requires information about chemicals used at every site • Emergency Planning and Community Right-to-Know Act – annual reporting to emergency responders of chemicals stored and used above certain quantities • Extensive State Oversight – implement federal laws and regulate drilling fluids and produced water management • Detailed state regulatory information available at www.STRONGERInc.org
Shale Production Grows to Over 30 bcfd by 2025By 2020, shale gas to comprise more than 40% of production, compared to 20% today Other Eagle Ford Marcellus Haynesville Woodford Fayetteville Barnett Source: Wood Mackenzie
United States Total Energy and Natural Gas Demand 2000-2030 U.S. Natural Gas Demand By Sector Total U.S. Primary Energy By Type Source: Wood Mackenzie
Adequate Natural Gas Supply at Competitive Prices Helps Grow the U.S. Economy U.S. Industrial Demand for Natural Gas • Lower gas prices have helped U.S. industry • Chemical and fertilizer facilities seeing increased utilization with lower gas prices • Shale gas helping chemical sector to create 17,000 jobs and build new plants • Energy-intensive industry can be more competitive in the global market • Additional potential demand from natural gas vehicles Source: Wood Mackenzie
Natural Gas’ Impact on the U.S. Economy and Employment Sources: IHS Global Insight, 2010 and 2013 U.S. Department of the Interior’s Office of Natural Resources Revenue, 2013 PricewaterhouseCoopers, 2013 • Natural gas companies contributed an average of $3 billion per year in gas royalty payments to the federal government between 2008 and 2012 • Overall contribution to the economy in jobs created and taxes paid is much greater: • $385 billion to the domestic economy in 2008 • $180 billion in labor income alone • Nearly 3 million American jobs • 600,000 directly employed in natural gas development • Shale development projected to add 1.4 million more U.S. jobs by 2035
As Supply Increases, Price Forecasts Have Dropped, With Henry Hub Now Forecast Under $6.00 to Mid - 2020s Source: EIA, Annual Energy Outlook 2011
DRAFT – NOTE that AEO 2013 shows price climb after 2035 As Supply Increases, Price Forecasts Have Dropped, With Henry Hub Now Forecast Under $6.00 to Mid - 2020s Source: EIA, Annual Energy Outlook 2013
NEEDS UPDATE Industry Already Recognizing Importance of Natural Gas by Investing in Storage, Pipelines, and Gas Generation
Pipeline System Extensive and Expanding at Record Pace • Between 2000 and 2010, FERC approved more than 16,000 miles of new interstate pipeline, with capacity to move an additional 113 bcf per day • Pipeline system connects U.S. with Canada and Mexico • Storage capacity grew 22% from 2006 - 2010 • Half of new storage is flexible high-turnover salt dome and is closer to customers
Market Responsive Infrastructure Additions Major Gas Pipeline Projects Certificated (MMcf/d) January 2000 to February 2011 Source: Federal Energy Regulatory Commission
U.S. Natural Gas Infrastructure: Anticipated Investment Through 2035 $205B in midstream infrastructure investments 125,000 jobs every year for 20 years $57B in federal, state & local tax revenue since 2005, pipeline avg. cap/ex: $8.8 Billion/yr Source: INGAA Foundation’s North American Natural Gas Midstream Infrastructure Through 2035
Natural Gas and Power Generation • Low capital and operating costs relative to other technologies • Clean burning – low carbon, GHGs, mercury, particulates, SOx, NOx • Low water use compared to other technology • Small land footprint • Easier to permit, finance and build • Natural gas key to making intermittent resources viable
Capital and Operating Costs Make Gas a Preferred Choice for Power Generation $/MWH Source: Wood Mackenzie Renewable sources & nuclear include a federal tax credit Assumes $2.00/mmbtu coal prices A combined-cycle gas turbine (CCGT) natural gas facility is the least expensive, full-cycle generation alternative.
Nuclear & Tons per year per thousand Biomass (Wood) Coal Natural Gas households Renewables Carbon Monoxide (CO) 51 5.8 1.5 0.0 Carbon Dioxide (CO2) Low 9,362 3,558 0.0 Nitrogen Oxides (NOx) 28 3.4 0.3 0.0 Particulate Matter 2.7 0.9 0.0 0.0 Volatile Organic 5.6 0.2 0.0 0.0 Compounds (VOC) Sulfur Dioxide (SO2) 2.8 5.0 0.2 0.0 Mercury 0.0 0.0001 0.0 0.0 Natural Gas Is Among the Cleanest Electric Generation Alternatives Middle emissions Most emissions Least emissions Natural gas is clean burning Sources: R.W. Beck data and, EPA “Mercury in Petroleum and Natural Gas Report”
Land Usage Also Makes Gas a Preferred Choice for Power Generation Acres of land needed to produce the fuel and generate enough electricity to serve 1,000 households for one year Acres Natural gas has the smallest footprint of any energy source Source: R.W. Beck and Black and Veatch for NGSA
To Make It All Happen, Industry Is Committed to Good Stewardship • Listening to and addressing community concerns • Use of stringent industry and government standards on land reclamation, well construction, water management and pipeline safety • Responsible hydraulic fracturing practices • Minimizing surface effects on land and infrastructure • Offshore safety and spill containment
… And Government Must Do Its Part As Well • Fair access to onshore and offshore resources • Continued strong and effective state regulation of hydraulic fracturing • Level playing field: avoid picking winners and losers through mandates • Tax policy must be fair, not burdensome, and compatible with resource development and job creation • Financial regulations must not create “economic drain” on investment • Current regulatory model for pipelines ensures safe, reliable operations and infrastructure investment
Greater Use of Natural Gas Resulted in a Plunge In U.S. Greenhouse Gas Emissions in 2012 “Greater use of natural gas in early 2012 resulted in the lowest U.S. carbon emissions since 1992.” -- Today in Energy, U.S. Energy Information Administration, August 1, 2012.
Water Intensity for Various Power Generation Technologies Gallons / MWh Gas-fired combined cycle power plants use much less water than thermal power plants with only a small contribution from gas production Sources: U.S. Department of Energy, “Energy Demands on Water Resources”, December 2006; NREL, “A Review of Operational Water Consumption and Withdrawal Factors for Electricity Generating Technologies,” March 2011; Chesapeake for shale gas water use * Assumes closed loop cooling tower **Other use includes water for other process uses such as emissions treatment, facilities 29
Storage Allows Flexibility and Reliability in Delivery NEEDS UPDATE TypeSites = Depleted Reservoir 326 = Aquifer 43 = Salt Cavern 31 • Natural gas storage capacity grew 22% between 2006 and 2010 to over 4.3 Tcf working capacity • Much of the new storage capacity has been high delivery, flexible salt storage • The new storage provides additional reliability to the pipeline system, as well as allowing quick response to peaking electric generation requirements Southwest 31
Resource Estimates Show Transformed Supply Outlook Shale gas exponentially increased the size of the natural gas resource base Improvements in technology brought down costs to develop Diversity of supply complements strong and growing pipeline system, reduces vulnerability to hurricanes, brings natural gas closer to consumers Resource size has increased with each successive report -- even though more than 200 trillion cubic feet drawn down in last decade alone Source: NPC Prudent Development Report, September 2011
Typical Shale Well: Horizontal Drilling and Hydraulic Fracturing Provide Long, Stable Production Life Initial Production from Typical Shale Well 2 to 15 million cubic feet per day* Initial Production Typical conventional well decline, 3 – 5 years Supply Stability • High initial production rates • Long and stable production lives First Production 40+ Years After First Production * Based on one company’s experience of typical production from the Haynesville shale wells
Distance of about 8 Empire State Buildings separates groundwater from fractures 34 Source: National Petroleum Council, September 2011
States and Industry Cooperate on Hydraulic Fracturing Fluid Disclosure • FracFocus – Public registry created and managed by state regulators in 2011. FracFocus 2.0 launched in 2013. • Captured over 50,000 wells and more than 400 participating companies; several states using as tool for compliance reporting • Fluid is 99% water and sand, less than 1% chemical additives • Searchable public database with well-by-well information and glossary of chemicals
Water Management • How Much Is 5 Million Gallons? • The 5 million gallons of water needed to drill and fracture a typical deep shale gas well is equivalent to the amount of water consumed by: • New York City in approximately • seven minutes • A 1,000 megawatt coal-fired power plant in • 12 hours • A golf course in • 25 days • 10 acres of cotton • in a season • While these represent continuing consumption, the water used for a gas well is a one-time use. • Recycling wastewater reduces environmental footprint, transportation costs and reliance on groundwater or municipal sources of water • Drilling companies in the Marcellus recycled more than 66 % of water June 2008-May 2010 • Re-used 44 million gallons of water & disposed of 21 million gallons (Source: Penn State University Hydrologist David Yoxtheimer) • Producer goal: Recycle 100% of produced water in Pennsylvania • State wide test results show recycled water meets all federal radium standards • Quote: “…all samples tested … showed levels at or below the normal naturally occurring background levels of radioactivity.” (Pennsylvania Department of Environmental Protection, March 7, 2011) • State and local testing of water to continue on regular basis, with strong support from natural gas companies 36
Natural Gas Royalty Payments and Tax Treatment In last 10 years, the natural gas industry paid the federal government more than $72 billion in natural gas royalties Payments are in addition to: billions of dollars paid in federal taxes, $7.5 billion in royalty payments to states, $2 billion in royalties to tribes and rent payments. Existing tax treatment provides reasonable recovery of exploration, lease acquisition and drilling costs and have enabled industry enough capital in recent years to produce a record amount of natural gas, resulting in: Affordable energy for households, businesses and industries Steady growth of jobs in natural gas and supporting industries; with projections of 1 million more by 2030 Capital expenditures exceeding $20 billion/year Billions in revenues to federal, state and tribal governments Source: U.S. Office of Natural Resources Revenue, 2011
Natural Gas Royalty Payments and Tax Treatment In last 10 years, the natural gas industry paid the federal government more than $72 billion in natural gas royalties Payments are in addition to: billions of dollars paid in federal taxes, $7.5 billion in royalty payments to states, $2 billion in royalties to tribes and rent payments. Existing tax treatment provides reasonable recovery of exploration, lease acquisition and drilling costs and have enabled industry enough capital in recent years to produce a record amount of natural gas, resulting in: Affordable energy for households, businesses and industries Steady growth of jobs in natural gas and supporting industries; with projections of 1 million more by 2030 Capital expenditures exceeding $20 billion/year Billions in revenues to federal, state and tribal governments Source: U.S. Office of Natural Resources Revenue, Department of the Interior, 2013
LNG Exports: Natural Gas Supply in Abundance Enough for all U.S. demand • Plan: Bring dollars to U.S. and reduce trade deficit by selling LNG to overseas trading partners. • Reduces U.S. trade deficit by billions of dollars. • Each $1 billion LNG sold = 6,000 new jobs. • Generates over $10 million/year in new tax revenue for federal, state, and local governments.
LNG Exports: Global Perspective • Reality Check • Most analysts estimate global market for U.S. natural gas to settle out at 5 and 6 Bcf/day. • With formidable competition emerging from overseas. • Proposed/potential 17 U.S. projects total about 23 Bcf/day. • Costs to build high and financiers must be convinced price advantage is sustainable for 30 years. • Market will sort out how many get built.
Proposed and Potential Export Terminals Source: FERC Office of Energy Projects, Feb. 2013
Realistic NGV Infiltration Lies Somewhere in the Midst of These Forecasts Sources: Wood Mackenzie/NGV America Natural Gas for Transportation Can Make Sense in Heavy-Duty Fleet Vehicles • Long term success of passenger NGVs linked to consumer confidence, not government subsidies • Heavy-duty truck conversions to natural gas can provide very healthy returns, but will be most successful in fleets • Reduces oil imports and improves energy security
Natural Gas Supply Terminology Resources All natural gas technically recoverable (excludes hydrates) Reserves Resources profitable with known technology Possible Reserves Resources profitable with known technology, 10% confidence Probable Reserves Resources profitable with known technology, 50% confidence Proven Reserves Resources profitable with known technology, 90% confidence 43
Industry Structure in the U.S. Physical Flow of Gas Source: EIA
INGAA Foundation Study Infrastructure Investment Summary Source: INGAA (2011), http://www.ingaa.org/File.aspx?id=14911
Natural Gas: Clean, Abundant, and Secure in the U.S. Contacts America’s Natural Gas Alliance Brian Kelly, Vice President, Legislative Affairs - bkelly@anga.us American Exploration & Production Council Bruce Thompson, President - bthompson@axpc.us American Gas Association Bree Raum, Director of Government Relations - braum@aga.org American Petroleum Institute Carrie Domnitch, Director of Federal Relations - domnitchc@api.org Center for Liquefied Natural Gas Bill Cooper, President - bill.cooper@LNGFacts.org Gas Processors Association Jeff Applekamp, Director of Government Affairs - japplekamp@GPAglobal.org Independent Petroleum Association of America Lee Fuller, Vice President of Government Relations - lfuller@ipaa.org Interstate Natural Gas Association of America Martin Edwards, Vice President, Legislative Affairs – medwards@ingaa.org Natural Gas Supply Association Jeff Schrade, Director of Political Communications – jeff.schrade@ngsa.org US Oil & Gas Association Albert Modiano, President – amodiano@usoga.org SLIDE UPDATES: Daphne Magnuson, NGSA Director of Public Affairs, dmagnuson@ngsa.org