Download
1 / 6
60 likes | 243 Vues
WT. nNOS -/-. iNOS -/-. eNOS -/-. n/i/eNOS -/-. B. A. 0. 0. 20. 20. 40. 40. Relaxation (%). Relaxation (%). 60. 60. 80. 80. 100. 100. *. *. 7. 6. 5. 9. 8. 6. 9. 8. 7. 5. Forskolin (-log mol/L). DEA-NONOate (-log mol/L). C. D. 0.7. *. *. *. *. 0.6. 0. 0.5.

E N D
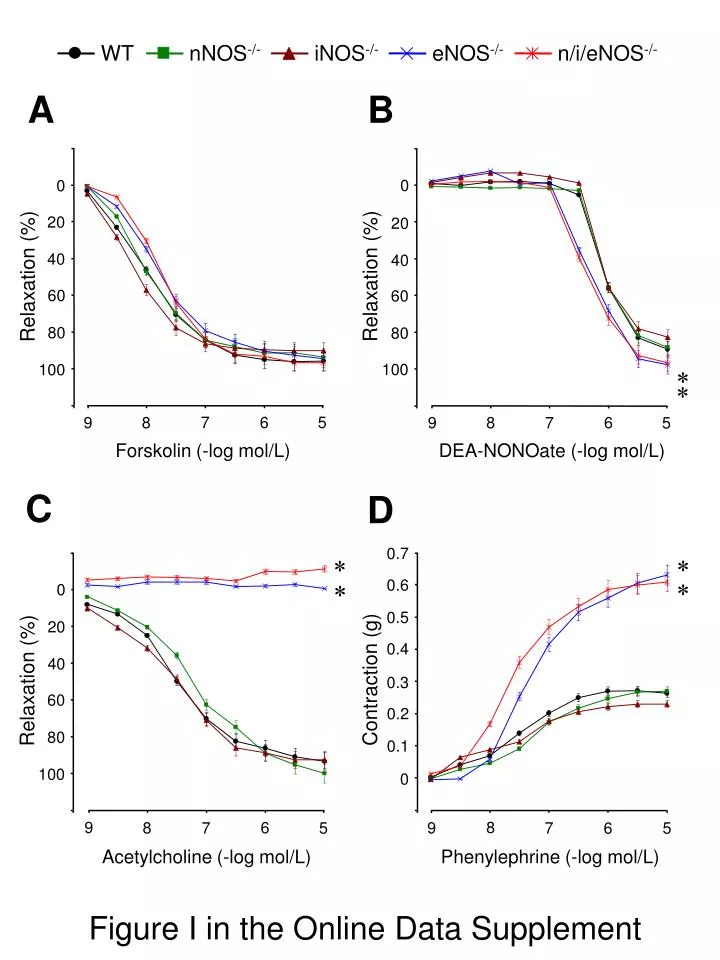
WT nNOS-/- iNOS-/- eNOS-/- n/i/eNOS-/- B A 0 0 20 20 40 40 Relaxation (%) Relaxation (%) 60 60 80 80 100 100 * * 7 6 5 9 8 6 9 8 7 5 Forskolin (-log mol/L) DEA-NONOate (-log mol/L) C D 0.7 * * * * 0.6 0 0.5 20 0.4 40 Contraction (g) Relaxation (%) 0.3 60 0.2 80 0.1 100 0 9 8 6 8 9 7 5 7 6 5 Acetylcholine (-log mol/L) Phenylephrine (-log mol/L) Figure I in the Online Data Supplement
* * 500 400 Plasma aldosterone (pg/mL) 300 200 100 0 -/- -/- -/- -/- n/i/eNOS nNOS iNOS eNOS WT 40 30 Plasma renin activity (ng/mL/hr) 20 10 0 -/- -/- -/- -/- n/i/eNOS nNOS iNOS eNOS WT A B Figure II in the Online Data Supplement
NS D A NS 160 0.3 140 120 100 0.2 Systolic blood pressure (mmHg) Epididymal white adipose tissue weight (g) 80 60 0.1 40 20 0 0 129SV C57BL/6J 129SV C57BL/6J B E NS NS 0.12 160 140 0.10 120 0.08 100 Peri-renal white adipose tissue weight (g) Diastolic blood pressure (mmHg) 0.06 80 60 0.04 40 0.02 20 0 0 129SV C57BL/6J 129SV C57BL/6J C F NS 160 140 120 100 Mean blood pressure (mmHg) 129SV C57BL/6J 80 60 NS 40 10 20 8 0 Diameter of epididymal white adipose cells(mm) 129SV C57BL/6J 6 4 2 0 129SV C57BL/6J Figure III A-F in the Online Data Supplement
NS NS I G NS 2.0 0.6 0.5 1.5 0.4 Plasma small dense LDL (mmol/L) Plasma triglyceride (mmol/L) 0.3 1.0 0.2 0.5 0.1 0 0 129SV 129SV C57BL/6J C57BL/6J J H NS 1.0 25 0.8 20 Plasma LDL (mmol/L) Plasma adiponectin (mg/mL) 0.6 15 0.4 10 0.2 5 0 0 129SV 129SV C57BL/6J C57BL/6J K 129SV C57BL/6J 30 30 25 25 20 20 Plasma glucose (mmol/L) Plasma glucose (mmol/L) 15 15 10 10 5 5 0 0 0 30 60 90 120 0 30 60 90 120 Time (minutes) Figure III G-K in the Online Data Supplement
NS NS NS NS NS NS L Large epicardial coronary arteries C57BL/6J 129SV 0.5 0.15 0.5 0.4 0.4 0.10 0.3 Perivascular fibrosis Neointimal formation 0.3 Medial thickening 0.2 0.2 0.05 0.1 0.1 0 0 0 C57BL/6J 129SV C57BL/6J 129SV C57BL/6J 129SV Coronary microvessels C57BL/6J 129SV 0.5 0.15 0.5 0.4 0.4 0.10 0.3 Perivascular fibrosis Neointimal formation 0.3 Medial thickening 0.2 0.2 0.05 0.1 0.1 0 0 0 C57BL/6J 129SV C57BL/6J 129SV C57BL/6J 129SV Figure III L in the Online Data Supplement
eNOS eNOS Actin Actin D A 6 months of age 1 month of age nNOS nNOS Actin Actin 1.0 1.0 0.8 0.8 0.6 0.6 nNOS / actin nNOS / actin 0.4 0.4 * 0.2 0.2 0 0 -/- -/- -/- -/- -/- -/- -/- -/- n/i/eNOS n/i/eNOS nNOS iNOS eNOS nNOS iNOS eNOS WT WT E B 6 months of age 1 month of age iNOS iNOS Actin Actin Actin 1.0 1.0 0.8 0.8 0.6 0.6 iNOS / actin iNOS / actin 0.4 0.4 0.2 0.2 0 0 -/- -/- -/- -/- -/- -/- -/- -/- n/i/eNOS n/i/eNOS nNOS iNOS eNOS nNOS iNOS eNOS WT WT F C 6 months of age 1 month of age 1.0 1.0 0.8 0.8 0.6 0.6 eNOS / actin eNOS / actin 0.4 0.4 0.2 0.2 0 0 -/- -/- -/- -/- -/- -/- -/- -/- n/i/eNOS n/i/eNOS nNOS iNOS eNOS nNOS iNOS eNOS WT WT Figure IV in the Online Data Supplement