Download
1 / 43
430 likes | 541 Vues
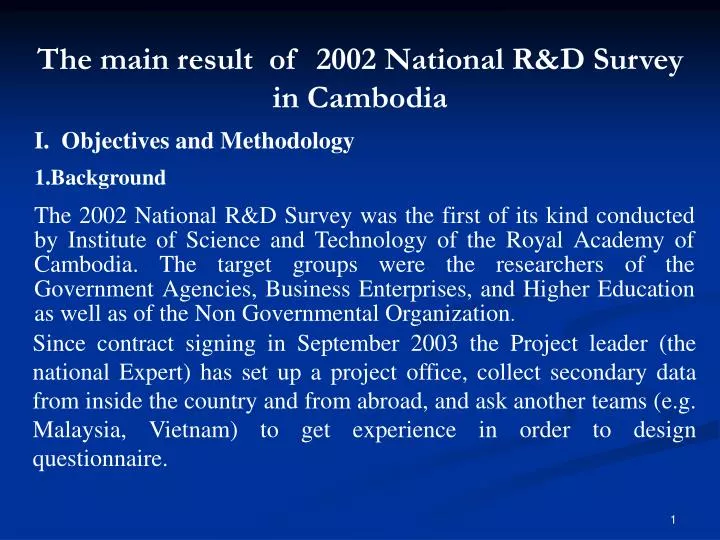
The main result of 2002 National R&D Survey in Cambodia. I. Objectives and Methodology 1. Background

E N D
The main result of 2002 National R&D Survey in Cambodia I. Objectives and Methodology 1.Background The 2002 National R&D Survey was the first of its kind conducted by Institute of Science and Technology of the Royal Academy of Cambodia. The target groups were the researchers of the Government Agencies, Business Enterprises, and Higher Education as well as of the Non Governmental Organization. Since contract signing in September 2003 the Project leader (the national Expert) has set up a project office, collect secondary data from inside the country and from abroad, and ask another teams (e.g. Malaysia, Vietnam) to get experience in order to design questionnaire.
Several discussions have been made among the staffs of the Institute of Science and Technology and others invited from other departments of the Royal Academy of Cambodia to improve the quality of the questionnaire. • 2.Objectives of the Survey • The main objectives of the survey were: • To provide and overview of the status of R&D in Cambodia. • To identified and highlight strengths and priorities of R&D in Cambodia. • To recommended strategies and action plans that need to be taken to enhance R&D in Cambodia.
3.Survey TeamIn Cambodia, it is not possible to conduct a survey with other method than face-to-face interview. Therefore for the four sectors, 4 field teams (each 3 people) were formed, each team responsible for data collection of a sector (Government Institutions, Higher Education, Business Enterprise or Non Governmental Organizations). A secretary and a technical assistant were also appointed to insure the workflow. 4.Survey Questionnaire After studying material provided from project experts, a questionnaire was draft, translated into Khmer language and two times tested before the monitoring visit of the Malaysian Experts in February 2004. A final questionnaire with 27 questions were revised and used to collect data from all sectors after comment of the experts.
5.Survey AdministrationFrom the secondary document we have collected all names and addresses of the possible institutions that could conduct R&D. Face-to-face interview was conducted to collect the data. Field team leaders, sometimes the surveyors themselves contacted first with the target institution in order to make appointment for interview. All surveyors were trained and instructed by an experience researcher.
Summary of Main Results Research and Development(R&D)Projects Government Sector 15 Higher Education Sector 18 Business Enterprise Sector 23 Private Non Profit Sector 54 Total110
Organizations with R&D SurveyedCompaniesGovernment Sector 14Higher Education Sector 11Business Enterprise Sector 21Private Non Profit Sector 48 Total 94 Expenditure Gross Domestic Expenditure on R&D (GERD) 8,357.01Mil.CR The GERD/GDP Ratio 0.05% Current Expenditure 6,840.87 Mil.CR Labor Cost 3,516.74 Mil.CR Operating Cost 3,324.13 Mil.CR Capital Expenditure 1,516.16 Mil.CR
Three Main Fields of Research (FOR)i. F20100-Social Science4,097.84 Mil.CRii. F11000-Med. & Health Science 1,832.33 Mil.CRiii. F11100- Engineering Science 519.03 Mil.CR Three Main Socio-Economic Objectives (SEO) i. S30300- Social Dev. and Com. Ser.1,768.72 Mil.CR ii. S30100-Health1,325.23 Mil.CR iii.S30200-Education and Training1,287.69 Mil.CR
ManpowerTotal R&D Research Personnel 1,625Total Number of Researchers 744Total FTE Research Personnel 494.28Total FTE Researchers 223 FTE per Research Personnel 30.42% FTE per Researcher 29.97% Degree Holders (PhDs, Masters, Bachelors) 744 Number of Researchers per 10,000 Labor Force 1.2 R&D Cost per Research Personnel 5.14 Mil.CR
Table M.1: GROSS DOMESTIC EXPENDITURE ON R&D(GERD) BY SECTOR OF PERFORMANCE AND SOURCE OF FUND 1. BUSINESS ENTERPRISE SECTOR (BERD)
Table M.2: GROSS DOMESTIC EXPENDITURE ON R&D(GERD) BY SECTOR OF PERFORMANCE AND TYPE OF RESEARCH
Table M.3: TOTAL R&D PERSONNEL BY SECTOR OF PERFORMENCE UNIT: HEADCOUNT
Table M.3: TOTAL R&D PERSONNEL BY SECTOR OF PERFORMANCE UNIT: HEADCOUNT
Table M.3: TOTAL R&D PERSONNEL BY SECTOR OF PERFORMENCE UNIT: HEADCOUNT
Table M.3: TOTAL R&D PERSONNEL BY SECTOR OF PERFORMENCE UNIT: HEADCOUNT
Table M.3: TOTAL R&D PERSONNEL BY SECTOR OF PERFORMENCE UNIT: HEADCOUNT
Table M.4: TOTAL R&D PERSONNEL FEMALES BY SECTOR OF PERFORMENCE UNIT: HEADCOUNT
Table M.4: TOTAL R&D PERSONNEL FEMALES BY SECTOR OF PERFORMENCE UNIT: HEADCOUNT
Table M.4: TOTAL R&D PERSONNEL FEMALES BY SECTOR OF PERFORMENCE UNIT: HEADCOUNT
Table M.4: TOTAL R&D PERSONNEL FEMALES BY SECTOR OF PERFORMENCE UNIT: HEADCOUNT
Table M.4:TOTAL R&D PERSONNEL FEMALES BY SECTOR OF PERFORMENCE UNIT: HEADCOUNT
Main Science and Technology Indicators 2002 <CAMBODIA> 1999 2000 2001 2002 2003 List of indicators - Excel file and electronic edition Higher Education Expenditure on R&D (HERD): 45. Higher Education Expenditure on R&D -- HERD (million current PPP $) 1.32 45.a. HERD (million national currency - for euro area, pre-EMU euro or EUR) 985.92 46. HERD as a percentage of GDP 0.0063 47. HERD (million 1995 dollars -- constant prices) 0.233 0.236 0.245 0.251 0.25 47.a. HERD -- Compound annual growth rate (constant prices) 4.0 1.0 4.1 2.38 -0.5 48. Percentage of HERD financed by industry 0.00 Higher Education R&D Personnel (FTE): 49. Higher Education researchers (FTE) 27.76 49.a. Higher Education researchers -- Compound annual growth rate NA 50. Higher Education researchers as a percentage of national total 12.45 51. Higher Education Total R&D personnel (FTE) 50.26 51.a. Higher Education Total R&D personnel -- Compound annual growth rate NA
Main Science and Technology Indicators 2002 <CAMBODIA> 1999 2000 2001 2002 2003 List of indicators - Excel file and electronic edition Government Expenditure on R&D: 52. Government Intramural Expenditure on R&D -- GOVERD (million current PPP $) 2.83 52.a. GOVERD (million national currency - for euro area, pre-EMU euro or EUR) 2,116.66 53. GOVERD as a percentage of GDP 0.01 54. GOVERD (million 1995 dollars -- constant prices) 0.50 0.506 0.53 0.539 0.537 54.a. GOVERD -- Compound annual growth rate (constant prices) 4.0 1.0 4.1 2.38 -0.5 55 Percentage of GOVERD financed by industry 0.00 Government R&D Personnel (FTE): 56. Government researchers (FTE) 113.00 56.a. Government researchers -- Compound annual growth rate NA 57. Government researchers as a percentage of national total 50.67 58. Government Total R&D personnel (FTE) 248.90 58.a. Government Total R&D personnel -- Compound annual growth rate NA
Main Science and Technology Indicators 2002 <CAMBODIA> 1999 2000 2001 2002 2003 List of indicators - Excel file and electronic edition Annex: Economic series: A.1. Gross Domestic Product (million national currency –for euro area, pre-EMU euro or EUR) 13130980 13809510 14543600 15667200 16721130 A.2. Gross Domestic Product (million current PPP $) 17,531.35 18,437.26 19,417.36 20,917.49 22,324.61 B. Implicit GDP Price Indices (1995 = 1.00) 10.80 7.00 5.70 5.50 NA C. Purchasing Power Parities (national currency per dollar) NA 5.00 5.30 5.20 5.30 E. Population (thousands) 11,599 12,200 13,099 13,341 13,588 F. Total Employment (thousands) 5,519 NA 6,175.83 NA NA G. Industrial employment (thousands) 258.90 NA 524.65 NA NA H. Labour Force (thousands) 360 NA 6,206.65 NA NA I. Exchange rates (national currency per dollar) 3,813.82 3,858.48 3,924.34 3,924.65 4,022.40
Cambodia does not have tradition in doing Research and Development. The result of the 2002 national survey on Research and Development has shown, that only 0.05% of the GDP has been spend on R&D. Conclusion The lack of financial resources is the main obstacle in implementing R&D activities in all the 4 sectors (government, higher education, private non profit institution, and business enterprise). On the other hand the lack of government incentive was considered as the major external limitation of doing the R&D.
In compare to other ASEAN countries, Cambodia does not have much researcher, only 1.2 per 10,000 labor force (In 1999 Singapore has 69.6 and 2000 up to 83.5 per 10,000 labor force. Malaysia has 15.5 per 10,000-labor force in 2000). • The share of GERD of Cambodia looks different from the other development countries. The business enterprise sector performed only 12.08% of GERD, whereas in the United State spent 74% for the experimental development and 64% for applied research in 1999, in Singapore 62% in 2000 and in the same year the private sector in Malaysia contribute 57.9%.
The Private Non Profit Sector performed most of the GERD (50.79%) and most of it for the applied research, which concentrates more in social science. • The first National Survey on R&D in Cambodia for the financial Year 2002 has generally shown Cambodia’s place internationally in R&D. In this respect, Cambodia needs to strengthen their R&D activities in all sectors. It should begin from the policy makers that they can make policy towards R&D.
The private sector should concentrate on its own research and development instate of import on technology. The university and the other higher education institution should cooperate more with private or public institution in order to make their own students or researchers apply their theory into practice.