Download
1 / 78
790 likes | 1.07k Vues
Proteomics. Bioinformatics Summer School Young-Jin Lee Iowa State University. Overview. PROTEOME. PROTE IN + GE NOME. PROTEOME. Complete complements of proteins to “complete set of Genes” in a given organism. Metabolome. Technically challenging. Proteome. System Biology.

E N D
Proteomics Bioinformatics Summer School Young-Jin Lee Iowa State University
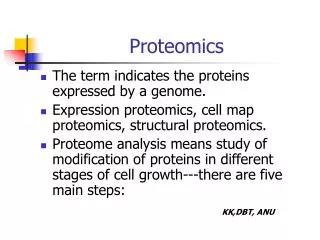
PROTEOME PROTEIN + GENOME PROTEOME Complete complements of proteins to “complete set of Genes” in a given organism
Metabolome Technically challenging Proteome System Biology Transcriptome Technically each part Genome
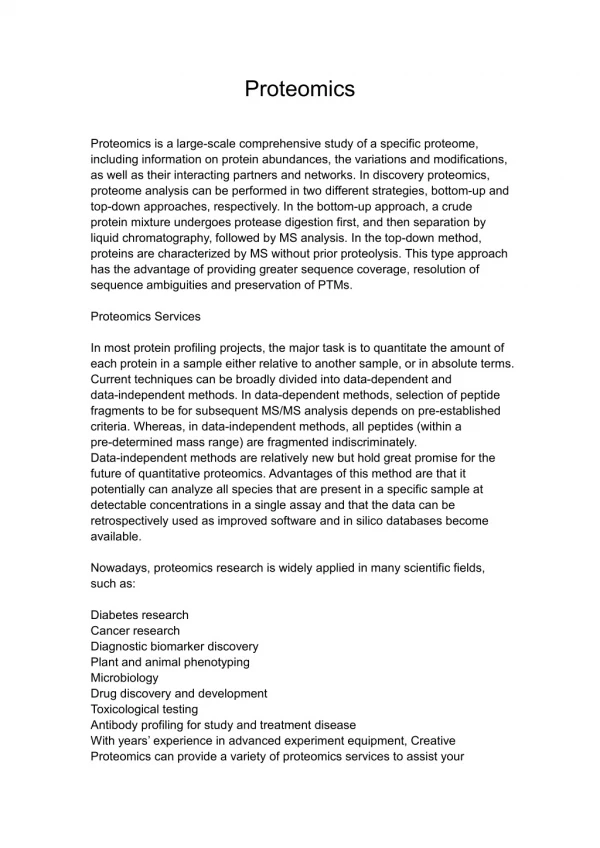
“Proteomics” Proteomics represents the effort to establish the identities, quantities, structures, and biochemical and cellular functions of all proteins in an organism, organ, or organelle, and how these properties vary in space, time, or physiological state. MCP 1.10 pg 675 National Research Council Steering committee
Proteomics can be defined as the qualitative and quantitative comparison of proteomes under different conditions to further unravel biological processes. - Expasy.org , “What is proteomics” In the wonderland of complete sequences, there is much that genomics cannot do, and so the future belongs to proteomics: the analysis of complete complements of proteins. Proteomics includes not only the identification and quantification of proteins, but also the determination of their localization, modifications, interactions, activities, and ultimately, their function. - Stanley Fields, “Proteomics in Genomeland”, science, 291, 1221-1224, 2001 Proteomics: a technology-driven and technology-limited discovery science - Kelvin H. Lee, trends in biotechnology, 19, 217, 2001
Top-down approach Targeted analysis PTM analysis Time line indicating the convergence of different technologies and resources into a proteomic process. S.D.Peterson & R.H.Aebersold, Nature Genetics, 2003
Why do we need to know about proteins when we can easily measure gene expression? • Proteins are the functional products of genes • There can be many proteins for every gene • alternative splicing • posttranslational modifications • Protein – Protein interactions are key • Genes do not tell us spatial and temporal distribution of proteins in a cell • Gene expression is not often correlated with protein expression patterns! • Yeaststudy (Gygi et al. 1999, Molec. Cell Biol. 19: 1720) • transcripts change proteins constant • proteins change - transcripts constant
One genome multiple Proteomes tagacgacct ggcccaacgc tgtgcccagt acaagaagga tggctgtgac ttcgccaaat ggcgttgtgt gctcaagatc ggcaagaaca ccccctccta ccaagctatc cttgagaatg ccaacgtact ggcacgctat gcgtccatct gccaatccca gcgcattgtg cccattgtagagcctgaggt gctgcctgat ggagatcacg accttgacag ggctcagaag gtcacagaga cagttctggc cgctgtgtac aaggcactca atgaccacca tgtcttcctg gagggcaccctcctgaagcc caacatggtg accgcaggac agtcctgctc caagaagtac aattatgagg acaacgctag agctacagtg ttggccctgt ccagaactgt gccagctgct gtccctggtgtgactttctt gtcaggaggt cagtcggagg aggatgcctc tgtcatttgg atgctatcaa caagatc tagacgacct ggcccaacgc tgtgcccagt acaagaagga tggctgtgac ttcgccaaat ggcgttgtgt gctcaagatc ggcaagaaca ccccctccta ccaagctatc cttgagaatg ccaacgtact ggcacgctat gcgtccatct gccaatccca gcgcattgtg cccattgtagagcctgaggt gctgcctgat ggagatcacg accttgacag ggctcagaag gtcacagaga cagttctggc cgctgtgtac aaggcactca atgaccacca tgtcttcctg gagggcaccctcctgaagcc caacatggtg accgcaggac agtcctgctc caagaagtac aattatgagg acaacgctag agctacagtg ttggccctgt ccagaactgt gccagctgct gtccctggtgtgactttctt gtcaggaggt cagtcggagg aggatgcctc tgtcatttgg atgctatcaa caagatc
Genomics vs Proteomics Genomics Proteomics • Species Independent • Cellular Functions at the Molecular level • Multiple Technology • Not just Engineering • Infinite Number of Proteins • Not Easy to Study Biological Systems, Dynamics, and Networks • Species Dependent • Focus is sequencing • A single technology • Engineering Problem • A finite Number of Genes • Easy Part
PROTEINS vs PROTEOMES Protein: Study structure-function of a single protein at a time Proteome: Study structure-function of multiple proteins at the same time in the complex celluar environment • New • Multiple proteins (>10~100) • One gene-multiple proteins • Identification • Mass Spectrometry • High throughput • One or two step purification • In the context of network and flux • Sensitive to cellular perturbation • Senstive to enviromental changes • OLD • One protein at a time • One gene-one protein • Characterization • Edman • Low throughput • Multiple step purification • Function Purification • --- • ---
Proteomics Tools • Analytical Protein/Peptide separation technologies • Mass Spectrometers • Database • Software/Bioinformatics
Types of Experiments • Protein Mining • Identifying as many proteins as possible in a sample. • Protein Profiling • Differences in protein expression between 2 or more samples • With or without relative quantitation • Protein Interaction analysis • Non-covalent complexes • Post Translational Modification analysis
How do we ID proteins • Two main ways • Finger Printing • Determine m/z of the Peptide ions only (MS) • Product Ion Scanning • Determine the m/z of the peptide ions (parent ions) • Fragment peptide ions • Determine m/z of Fragments (Product Ions)
Finger Printing • Take a Pure Protein of Interest • 1d or 2d gel spot • HPLC fraction • Digest with a Specific Protease • Trypsin • Analyze peptides with a Mass spectrometer • Usually MALDI-TOF, but it can be any type as long as the mass is accurate. • Pros: Very Fast, Easy, Cheap
K R R K K R K R NH2 COOH 300.12 da 312.56 da 418.56 da 551.52 da 718.23 da 407.39da Finger Printing Digestion with trypsin
Finger Printing example Compare peptide mass list from all the proteins in the database of given species.
Finger Printing limitations • You need a mass spectrometer capable of reasonable accurate masses • 50 ppm • MALDI with DE and a reflector • Genome must be pretty small • Yeast or smaller for good results • Works almost exclusively for single protein only.
Product Ion Scanning • Digest Protein with tyrpsin • Determine the m/z of a peptide ion • MALDI, ESI • Isolate the peptide ion from any other ions (inside the mass spectrometer) • Fragment the peptide ion • Determine mass of Fragments • Obtain AA sequence data from fragments
Peptide Fragmentation Roepstorff Nomenclature for Possible Peptide Fragments y3y2y1 R O R R O R O 1 2 3 4 H H H C H C H C H H C COOH C C N N C N N H 2 b1b2b3
y8 y7 y5 y4 y3 y6 y2 Val Phe Gly Lxx Lxx Asp Glu Asp Lys b5 b2 b3 b4 b6 b7 b8 Tryptic fragment: y3 b2 100 391.1 247.0 95 90 789.3 y7 b3 85 80 a2 304.0 y4 75 219.0 506.2 b4 70 417.2 65 60 Lxx Lxx Phe Asp Glu Gly 55 y8 789.3 50 y5 Relative Abundance 936.4 45 619.2 y6 40 b5 732.2 35 530.2 b8 30 b6 248.1 25 889.4 645.3 418.1 305.1 y2 20 b7 937.4 15 262.1 774.4 431.1 372.2 468.4 205.0 10 318.1 904.5 5 0 150 200 250 300 350 400 450 500 550 600 650 700 750 800 850 900 950 m/z Example MS/MS spectrum
Monoisotopic mass: the sum of all the lightest isotopes. Average mass: the abundance weighted sum of all the isotopes of all the elements present. Amino acid3LCSLCAverageMonoisotopic GlycineGly G 57.0519 57.02146 Alanine Ala A 71.0788 71.03711 Serine Ser S 87.0782 87.02303 Proline Pro P 97.1167 97.05276 Valine Val V 99.1326 99.06841 ThreonineThr T 101.1051 101.04768 CysteineCys C 103.1388 103.00919 LeucineLeu L 113.1594 113.08406 Isoleucine Ile I 113.1594 113.08406 AsparagineAsn N 114.1038 114.04293 Aspartic acid Asp D 115.0886 115.02694 Glutamine Gln Q 128.1307 128.05858 Lysine Lys K 128.1741 128.09496 Glutamic acid Glu E 129.1155 129.04259 Methionine Met M 131.1926 131.04049 Histidine His H 137.1411 137.05891 PhenyalaninePhe F 147.1766 147.06841 ArginineArg R 156.1875 156.10111 Tyrosine Tyr Y 163.1760 163.06333 Tryptophan Trp W 186.2132 186.07931
Big Problem • Can take you a very long time to “sequence” a “good” product ion spectra without a computer • 30 minutes if you are good. • 1-2 days to never if you are not. • One experiment can generate 10,000 MS/MS spectra
Search Engines (Computer program) • Automated De novo sequencing • Lutefisk • PepNovo • Peaks • denovoX • Peptide Sequence tags • Guten-Tag • Cross Correlation • SEQUEST • Probability Based • Mascot (sort of) • xTandem! • OMSSA
Pattern matching Not sequencing Use the protein sequences in the database Do an in silicodigest Calculate m/z of in silico peptides Match the “pattern” of masses in the mass spectrometer to the in sillico “pattern” Score the result
Low Accuracy • NR DataBase approx • 3 Million protein sequences • 180 thousand tryptic peptide sequences (within error) = Match!!! Time = 15 seconds
Generates an E-valueE= # of times this would occur by chance The E-value expresses just how unlikely a greater hyperscore is. X!Tandem calculates the E-value by extrapolating the red line of the log histogram. For the example shown, a hyperscore of 83 would occur by chance where the red line crosses 83. The log of this value — the E-value — is -8.2, as shown. # results hyperscore log(# results) E-value=e-8.2
Proteins from Peptides • It is not trivial to reconstruct Proteins from identified peptides • More than one protein may contain the same peptide sequence • MS/MS spectra may match more than one sequence
Protein vs. Peptide vs. MS/MS spectraAnal. Chem. 2003, 75, 4646-4658
False positive vs. False negative Cutoff Score True Negative True Positive False Negative False Positive
2-d electrophoresis • Disadvantages • Modest detection limit • High abundance proteins • Limited dynamic range • 104 @ best • Protein Bias (pI) • Difficult to automate • Labor intensive • Requires many more mass spec runs • Advantages • High Resolution separation • Can get quantitation by staining • Good “snapshot” of the Proteome!
FIG. 3. Protein expression profiling by 2-DE. Whole-cell lysates from nontransformed and Abelson murine leukemia virus (AMuLV)-transformed mouse fibroblasts were resolved by 2-DE, and proteins were visualized by silver staining. Differentially expressed proteins were excised from the gel and identified by MS. Paul R. Graves1 and Timothy A. J. Haystead1,2*Microbiology and Molecular Biology Reviews, March 2002, 66. 39-63
DIGE 2-D difference gel electrophoresis
Selective staining for phosphoprotein or glycoprotein http://www.probes.com
LC-MS/MS based proteomics • Advantage • Can be used for any acidic or basic proteins • Automation: reproducible, robust, time-saving • Dynamic range • Disadvantage • Quantification -> ICAT or other methods are being developed. • Limitations in chromatographic separation -> 2D LC • Difficult for small amount of proteins in large mixtures • No additional direct information on proteins (i.e. MW, Ip)
Two problems in LC-MS/MS based proteomics Automatic program. Sample complexity John Yates (Scripps) SEQUEST : Computer algorithm for MS/MS database search. MUDPIT (Multi Dimensional Protein Identification Technology)
Yates, R,III et.al, Nat. Biotechnology, 2001, 19, 242 MUDPIT (Multidimensional protein identification technology) analysis of S. Cerevisiae ->1484proteins identified, 131 membrane proteins
CID MS-1 MS-2 Typical MUDPIT Preparation(Multidimensional Protein Identification Technology) • Advantages • Dynamic Range 105 • Sensitivity! Low abundance proteins • Minimized protein bias • Highly automated • Carrier effect • Disadvantages • Poor isoform & modification distinction • Still overwhelms the mass spectrometer. • Does not give you a very good “snapshot” RP fractionation SCX fractionation Micro electrospray ionization Protein digest mixtures Auto MS/MS detection Tandem Mass Spectra Database search protein I.D.