Download
1 / 12
120 likes | 230 Vues
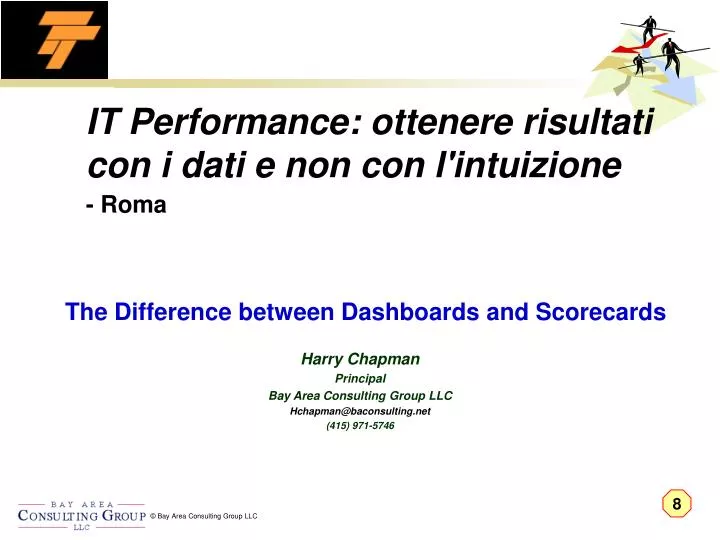
The Difference between Dashboards and Scorecards. Harry Chapman Principal Bay Area Consulting Group LLC Hchapman@baconsulting.net (415) 971-5746. 8. Quality. Productivity. Risk. Cost. Types of Measures. Operations Performance (How Well an Organization Delivers Today). Demand for

E N D
The Difference between Dashboards and Scorecards Harry Chapman Principal Bay Area Consulting Group LLC Hchapman@baconsulting.net (415) 971-5746 8
Quality Productivity Risk Cost Types of Measures Operations Performance (How Well an Organization Delivers Today) Demand for Service Operations Delivery Measures: Volume
Measures are Designed to Meet Organizational Objectives Operations Performance (How Well an Organization Delivers Today) Service Delivery Demand for Service Operations Delivery Customers Measures: Volume Efficiency Measures (Doing “Things Right”) Effectiveness Measures (Doing the “Right Things”) Planning Measures (Process Renewal) • Customer/Prospect Evolution • Workload Trends • Process Utilization/Capacity • Sourcing Trends/ • Opportunities • Reliability • Accuracy • Timeliness • Quality
Quality Productivity Risk Cost Achievement of Strategic Initiatives Measures: Volume Types of Measures Strategic Achievement (How Well an Organization Management Improves Operations Delivery) Operations Performance (How Well an Organization Delivers Today) Demand for Service Operations Delivery
Focus Varies by Organizational Level Top Management Top Management Strategic Initiatives (Ability to Compete in the Future) Group Leaders Operational Activities (Today’s Performance) Directors and Staff
Quality Productivity Risk Cost Reporting Needs to Match Management Needs Top Management Top Management Operations Dashboard Strategic Initiatives (Ability to Compete in the Future) Volume Division Leaders Productivity Cost Quality Risk Measures $ $ Q2 Q1 Q3 Q1 Q2 Q3 Operational Activities (Today’s Performance) Directors and Staff Initiative Assessment
Measures $ The High Performance Strategy The Revenue Growth Strategy Operations Dashboard “Improve returns by enabling the broadening of the sources of revenue both from new markets and from current customers” “Improve operating efficiency and effectiveness by providing low-cost, high-value, integrated solutions across channels and reliable technology infrastructure” Financial Perspective Q1 Q3 Q2 Improve Returns Client/Customer Perspective Improve Operating Efficiency & Performance Customer Value and Experience • Outsourcing • Cost management • Process improvement • TD Waterhouse and ITG • Customer experience • Integrated channels • Business rules processing • Network availability • Available capacity • Capacity on demand • Downtime Availability Internal Perspective Volume • Solutions capability • Project management • PMO / Process • Methodology • Partnering (knowledge trsfr) Solutions Integration & Project Delivery Capability Integration / Web-enabled Channels • EAI • Web Services • Web enablement • Integrated channels Learning &Growth Perspective • Knowledge management / portal • Training & recruitment • Management development • Competencies, skills • Strategy-focused investments • Personal goals & alignment • Communications alignment • Management Systems Increase TDit & Employee Performance Levels IT Skills and Capabilities Performance Management Cost Productivity Quality Risk $ Quality Productivity Risk Cost Q1 Q3 Q2 Types of Measures Operations Performance (How Well an Organization Delivers Today) Strategic Achievement (How Well an Organization Management Improves Operations Delivery) Performance Assessment is Based on Ability to Execute with Today’s Processes, Technologies and Staff Performance Assessment is Based on Ability to Execute the Strategy though Implementation of Initiatives
Measures $ The High Performance Strategy The Revenue Growth Strategy Operations Dashboard “Improve returns by enabling the broadening of the sources of revenue both from new markets and from current customers” “Improve operating efficiency and effectiveness by providing low-cost, high-value, integrated solutions across channels and reliable technology infrastructure” Financial Perspective Q1 Q3 Q2 Improve Returns Client/Customer Perspective Improve Operating Efficiency & Performance Customer Value and Experience • Outsourcing • Cost management • Process improvement • TD Waterhouse and ITG • Customer experience • Integrated channels • Business rules processing • Network availability • Available capacity • Capacity on demand • Downtime Availability Internal Perspective Volume • Solutions capability • Project management • PMO / Process • Methodology • Partnering (knowledge trsfr) Solutions Integration & Project Delivery Capability Integration / Web-enabled Channels • EAI • Web Services • Web enablement • Integrated channels Learning &Growth Perspective • Knowledge management / portal • Training & recruitment • Management development • Competencies, skills • Strategy-focused investments • Personal goals & alignment • Communications alignment • Management Systems Increase TDit & Employee Performance Levels IT Skills and Capabilities Performance Management Cost Productivity Quality Risk $ Quality Productivity Risk Cost Q1 Q3 Q2 Types of Measures Performance Measurement Dashboard Balanced Scorecard Operating Performance (How Well the Company Delivers Today) Strategic Achievement (How Well Management Improves Operations Delivery) Performance Assessment is Based on Ability to Execute with Today’s Processes, Technologies and Staff Performance Assessment is Based on Ability to Execute the Strategy though Implementation of Initiatives
Let’s look at a Real Project… • For the Senior Vice President of Operations for a large Financial Services Firm: • The situation: • Client was newly appointed head of the operations division without operations background • Client was OVERWHELMED with data – far too much data and too little information • Hired to bring “Balanced Scorecard” approach to situation and develop meaningful reporting
An example of the existing data received periodically… Example
We Used Their Recently Created Operating Principles as the Basis for Selecting Key Measures…. Example