Download
1 / 34
340 likes | 343 Vues
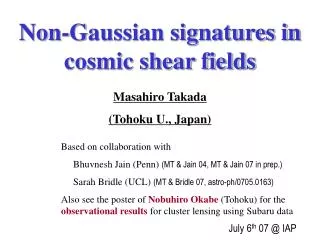
Non-Gaussian signatures in cosmic shear fields. Masahiro Takada (Tohoku U., Japan). Based on collaboration with Bhuvnesh Jain (Penn) (MT & Jain 04, MT & Jain 07 in prep.) Sarah Bridle (UCL) (MT & Bridle 07, astro-ph/0705.0163)

E N D
Non-Gaussian signatures in cosmic shear fields Masahiro Takada (Tohoku U., Japan) Based on collaboration with Bhuvnesh Jain (Penn) (MT & Jain 04, MT & Jain 07 in prep.) Sarah Bridle (UCL) (MT & Bridle 07, astro-ph/0705.0163) Some part of my talks is based on the discussion of WLWG Oct 26th 07 @ ROE
Outline of this talk • What is cosmic shear tomography? • Non-Gaussian errors of cosmic shear fields and the higher-order moments • Parameter forecast including non-Gaussian errors • Combining WLT and cluster counts • Summary
Cosmological weak lensing – cosmic shear • Arises from total matter clustering • Not affected by galaxy bias uncertainty • well modeled based on simulations (current accuracy, <10% White & Vale 04) • A % level effect; needs numerous (~108) galaxies for the precise measurements z=zs past z=zl observables Large-scale structure z=0 present
(e.g., Hu 99, 02, Huterer 01, MT & Jain 04) Weak Lensing Tomography • Subdivide source galaxies into several bins based on photo-z derived from multi-colors (e.g., Massey etal07) • <zi> in each bin needs accuracy of ~0.1% • Adds some ``depth’’ information to lensing – improve cosmological paras (including DE) +m(z)
Tomographic Lensing Power Spectrum • Tomography allows to extract redshift evolution of the lensing power spectrum. • A maximum multipole used should be like l_max<3,000
Tomographic Lensing Power Spectrum (contd.) • Lensing PS has a less feature shape, not like CMB • Can’t better constrain inflation parameters (n_s and alpha_s) than CMB • Need to use the lensing power spectrum amplitudes to do cosmology: the amplitude is sensitive to A_s, de0 (or m0), w(z).
Lenisng tomography (condt.) • WLT can be a powerful probe of DE energy density and its redshift evolution. • Need 3 z-bins at least, if we want to constrain DE model with 3 parameters (_de,w0, wa) • Less improvement using more than 4 z-bins, for the 3 parameter DE model
An example of survey parameters (on a behalf of HSCWLWG) Area: ~2,000 deg^2 Filters: B~26,V~26,R~26,i’~25.8,z’~24.3 Nights: 150-300 nights • PS measurement error (survey area)^-1 • Requirements: expected DE constraints should be comparable with or better than those from other DE surveys in same time scale (DES, Pan-Starrs, WFMOS) • Note: optimization of survey parameters are being investigated using the existing Suprime-Cam data (also Yamamoto san’s talk)
Non-linear clustering • Most of WL signal is from small angular scales, where the non-linear clustering boosts the lensing signals by an order of magnitude (Jain & Seljak97). • Large-scale structures in the non-linear stage are non-Gaussian by nature. • 2pt information is not sufficient; higher-order correlations need to be included to extract all the cosmological information • Baryonic physics: l>10^3 Non-linear clustering l_max~3000
Non-Gaussianity induced by structure formation • Linear regime O()<<1; all the Fourier modes of the perturbations grow at the same rate; the growth rate D(z) • The linear theory, based on FRW + GR, gives robust, secure predictions • Mildly non-linear regime O()~1; a mode coupling between different Fourier modes is induced • The perturbation theory gives the specific predictions for a CDM model • Highly non-linear regime; a more complicated mode coupling • N-body simulation based predictions are needed (e.g., halo model) • Correlations btw density perturbations of different scales arise as a consequence of non-linear structure formation, originating from the initial Gaussian fields • However, the non-Gaussianity is fairly accurately predictable based on the CDM model
Aspects of non-Gaussianity in cosmic shear • Cosmic shear observables are non-Gaussian • Including non-Gaussian errors degrades the cosmological constraints? • Realize a more realistic ability to constrain cosmological parameters • The dependences for survey parameters (e.g., shallow survey vs. deep survey) • Yet, adding the NG information, e.g. carried by the bispectrum, is useful?
l1 l1 l2 l2 l2 l2 Gaussian errors Non-Gaussian errors Covariance matrix of PS measurement (MT & Jain 07 in prep.) • Most of lensing signals are from non-linear scales: the errors are non-Gaussian • PS covariance describes correlation between the two spectra of multipoles l1 and l2 (Cooray & Hu 01), providing a more realistic estimate of the measurement errors • The non-Gaussian errors for PS arise from the 4-pt function of mass fluctuations in LSS l1 l1
Diagonal: Gaussian Off-diagonal: NG, 4-pt function 30 bins: 50<l<3000 If significant correlations, r_ij1 The NG is stronger at smaller angular scales The shot noise only contributes to the Gaussian (diagonal) terms, suppressing significance of the NG errors Correlation coefficients of PS cov. matrix w/o shot noise with shot noise
Principal component decomposition of the PS covariance matrix Correlations btw Cl’s at different l’s
(in z-space as well for WLT) Power spectrum with NG errors • The band powers btw different ells are highly correlated (also see Kilbinger & Schneider 05) • NG increases the errors by up to a factor of 2 over a range of l~1000 • ell<100, >10^4, the errors are close to the Gaussian cases
Signal-to-noise ratio: SNR • Data vector: power spectra binned in multipole range, l_min<l<l_max, (and redshifts) • In the presence of the non-Gaussian errors, the signal-to-noise ratio for a power spectrum measurement is • For a larger area survey (f_sky ) or a deeper survey (n_g ), the covariance matrix gets smaller, so the signal-to-noise ratio gets increased; S/N
Signal-to-noise ratio: SNR (contd.) Gaussian Non-Gaussian • Multipole range: 50<l<l_max • Non-gaussian errors degrade S/N by a factor of 2 • This means that the cosmic shear fields are highly non-Gaussian (Cooray & Hu 01; Kilbinger & Schneider 05) 50<l<l_max
_de Non-Gaussian Error w_0 w_a n_s …. _mh^2 _bh^2 The impact on cosmo para errors error ellipse _de • We are working in a multi-dimensional parameter space (e.g. 7D) w_0 w_a n_s …. • Volume of the ellipse: VNG2VG • Marginalized error on each parameter length of the principal axis: NG~2^(1/Np)G(reduced by the dim. of para space) • Each para is degraded by slightly different amounts • Degeneracy direction is slightly changed _mh^2 _bh^2
Bernardeau+97, 02, Schneider & Lombardi03, Zaldarriaga & Scoccimarro 03, MT & Jain 04, 07, Kilbinger & Schneider 05 An even more direct use of NG: bispectrum given as a function of separation l given as a function of triangles
A more realistic parameter forecast MT & Jain in prep. 07 WLT (3 z-bins) + CMB • Parameter errors: PS, Bisp, PS+Bisp • G:(_de)=0.015, 0.014, 0.010 NG: 0.016(7%),0.022(57), 0.013(30) • (w0)= 0.18, 0.20, 0.13 0.19(6%),0.29(45), 0.15(15) • (wa)= 0.50, 0.57, 0.38 0.52(4%),0.78(73), 0.41(8) • The errors from Bisp are more degraded than PS • Need not go to 4-pt! • In the presence of systematics, PS+Bisp would be very powerful to discriminate the cosmological signals (Huterer, MT+ 05)
WLT + Cluster Counts MT & S. Bridle astro-ph/0705.0163 • Clusters are easy to find from WL survey itself: mass peaks (Miyazaki etal.03; see Hamana san’s talk for the details) • Synergy with other wavelength surveys (SZ, X-ray…) • Combining WL signal and other data is very useful to discriminate real clusters from contaminations • Combing WL with cluster counts is useful for cosmology? • Yes, would improve parameter constraints, but how complementary? • Cluster counts is a powerful probe of cosmology, established method (e.g., Kitayama & Suto 97) Angular number counts: w0=-1 w0=-0.9
Mass-limited cluster counts vs. lensing-selected counts Hamana, MT, Yoshida 04 Halo distribution Convergence map • Mass-selected sample (SZ) vs lensing-based sample 2 degrees
Miyazaki, Hamana+07 Mass Light (galaxies) Secure candidates X-ray
A closer look at nearby clusters (z<0.3) ~30 clusters (Okabe, MT, Umetsu+ in prep.) • Subaru is superb for WL measurement • A detailed study of cluster physics (e.g. the nature of dark matter)
Cross-correlation between CC and WL Cluster A patch of the observed sky Shearing effect on background galaxies • If the two observables are drawn from the same survey region, the two probe the same cosmic mass density field in LSS • Around each cluster, stronger shear signal is expected: up to ~10% in induced ellipticities, compared to a few % for typical cosmic shear • A positive cross-correlation is expected: Clusters happen to be less/more populated in a given survey region than expected, the amplitudes of <> are most likely to be smaller/greater • Note that < >: 2pt, cluster counts (CC): 1pt =>no correlation for Gaussian fields
Cross-correlation btw CC and WL (contd.) M/M_s>10^13 • Shown is the halo model prediction for the lensing power spectrum • A correlation between the number of clusters and the ps amplitude at l~10^3 is expected. M/M_s>10^14 M/M_s>10^15
Cross-covariance between CC + WL • Cross-covariance between PS binned in l and z and the cluster counts binned in z • The cross-correlation arises from the 3-pt function of the cluster distribution and the two lensing fields of background galaxies • The cross-covariance is from the non-Gaussianity of LSS • The structure formation model gives specific predictions for the cross-covariance
SNR for CC+WL • The cross-covariance leads to degradation and improvement in S/N up to ~20%, compared to the case that the two are independent
Parameter forecasts for CC+WL lensing-selected sample mass-selected sample • Lensing-selected sample with detection threshold S/N~10 contains clusters with >10^15Msun • Lensing-selected sample is more complementary to WLT, than a mass-selected one? Needs to be more carefully addressed WL CC+WL CC+WL with Cov
HSCWLS performance (WLT+CC+CMB) • Combining WLT and CC does tighten the DE constraints, due to their different cosmological dependences • Cross-correlation between WLT and CC is negligible; the two are considered independent approximately
Real world: issues on systematic errors • E/B mode separation as a diagnostics of systematics • Non-gaussian signals in weak lensing fields • Theoretical compelling theoretical modeling of DE • Shape measurement accuracies vs. galaxy types, morphology, magnitudes… • Data reduction pipelines optimized for weak lensing analyses • Exploring a possibility to self-calibrate systemtaics, by combining different methods • Non-linearities in lensing; reduced shear needs to be included? • Intrinsic alignments • Source clustering, source-lens coupling • Usefulness of Flexions? • Develop a sophisticated photo-z code • Photo-z vs. color space? • Requirement on spec-z sub-sample; from which data? • N-body simulations (initial conditions, how to work in multi-dimenaional parameter space for N-body simulations, the strategy…) • DE vs. modified gravity • Fourier space vs. real-space; explore an optimal method to measure power spectrum from actual data, with complex survey geometry • Exploring a code of likelihood surface in a multi-dimensional parameter space (MCMC); how to combine with other probes such as CMB, 2dF/SDSS, …. • Can measure DE clustering or neutrino mass from WL or else with HSC? • Defining survey geometry: a given total survey area, many small-patched survey regions vs. continuous survey region • Adding multi-color info for WL based cluster finding; color properties of member ellipticals would be useful to discriminate real lensing mass peaks as well as know the redshift • How to calibrate mass-observable relation for cluster experiments? WL + colors + SZ + X-ray? • Constraining mass distribution within a cluster with HSC WL survey; mass profile, halo shape, etc • Strong lens statistics • Imaging BAO • Man power problem: who and when to work on these issues? • …
If several observables (O1,O2,…) are drawn from the same survey region: e.g., WLPS, WLBisp, CC,… Each observable contains two contributions (C: cosmological signal and S: systematics) Covariances (or correlation) between the different obs. If the systematics in different obs are uncorrelated The cosmological covariances are fairly accurately predictable Taking into account the covariances in the analysis could allow to discriminate the cosmological signals from the systemacs – self-calibration Working in progress Issues on systematics: self-calibration
Summary • The non-Gaussian errors in cosmic shear fields arise from non-linear clustering in structure formation • The CDM model provides the specific predictions, so the NG errors are in some sense accurately predictable • Bad news: the NG errors are very important to be included for current and, definitely, future surveys • The NG degrades the S/N for the lensing power spectrum measurement up to a factor of 2 • Good news: the NG impact on cosmo para errors are less significant if working in a multi-dimensional parameter space • ~10% for 7-D parameter space • WLT and cluster counts, both available from the same imaging survey, can be used to tighten the cosmological constraints