Download
1 / 29
290 likes | 470 Vues
Modeling of Underwater Liquid Releases, Slick Transport & Evaporation. V.M. Fthenakis and U.S. Rohatgi Department of Advanced Technology Brookhaven National Laboratory. Discharge Model. APG Spill from a Barge in Mississipi River -Baton Rouge, Louisiana. Overview.

E N D
Modeling of Underwater Liquid Releases, Slick Transport & Evaporation V.M. Fthenakis and U.S. Rohatgi Department of Advanced Technology Brookhaven National Laboratory
APG Spill from a Barge in Mississipi River -Baton Rouge, Louisiana
Overview • Consequence analysis requires modeling of 1) discharge, 2) transport in water, 3) evaporation and 4) atmospheric dispersion • Previous discharge models limited to initial hydrostatic pressure difference (Dodge, 1980; Fannelop, 1994) . A new discharge model was developed • Oil slick transport in rivers (Shen & Yapa, 1988) • Multicomponent evaporation ( PAVE) • Atmospheric Dispersion (ALOHA, ISC)
Modeling • Discharge Model • Phase 1- Initial hydrostatic pressure difference • Phase 2- Periodic vessel movements • Verification & Sensitivity Analysis • Spreading & Evaporation Model • Application to Real Incident • Atmospheric Dispersion Modeling • Verification of Predicted Concentrations
Discharge Model • Assumptions: • Isothermal Outflow and/or Inflow • Incompressible, Immiscible fluids; • Ideal gas expansion in the vessel’s void space • Based on analytical solutions for non-vented and vented vessels; discharges due to hydrostatic pressure and periodic oscillations from waves and bouncing The model predicts • Water inflows / fluid-and-water outflows with time • Change of void space and fluid inventory with time • Change of water level in the barge with time • Critical water layer thickness and inventory in steady-state
Discharge Model -Phase 1 Verification • Experimental data (Dodge et al., 1980)
Discharge Model- Sensitivity Analysis • Gas-phase pressure • Temperature & Saturation Pressure • Depth of the break • Area of the break • Discharge coefficient • Fluid density • Amplitude of vessel movement • Period of vessel movement
River Spreading Modeling • Advection of the slick due to river currents and the wind • Spreading of the slick due to gravitational, inertia, viscous and surface tension forces • Multi-component evaporation
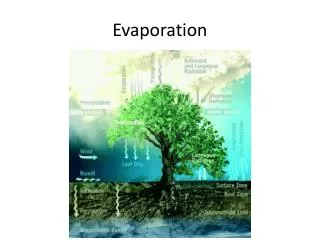
Evaporation Modeling • Experimental studies -(crude oil, Payne et al. 1984; chlorobenzene and toluene, Waden and Triemer, 1989) • PAVE multi-component evaporation model • Diffusion through the liquid phase and mass transfer from surface. • Heat conduction to water, convection to the atmosphere, solar radiation, atmospheric radiation and evaporative cooling • Verified with chlorobenzene and toluene evaporation data
A Barge Discharge Incident • A barge-tank containing APG overturned in the Mississippi River in March 1997 • For days the barge was bounced by tugboats & moved by river currents leaking APG from valves under the water • Buoyant APG fluid floated to the surface • Barge was loaded with ~400,000 gal of APG and lost at least 15% of it during the incident • The incident lasted 11 days till barge was upheld and remaining APG recovered
Baton Rouge -APG Spill in MississipiALOHA predictions on MARPLOT map
Conclusion • New model of underwater liquid leaks from vessel in periodic motion. • New model of spreading of a river spill. • Limited verification and sensitivity analysis showed that predictions are reasonable. • The models were applied to a known incident and the predictions were in agreement with observations and measurements. • These models may be used in real time to minimize consequences of accidental releases.