Download
1 / 25
250 likes | 259 Vues
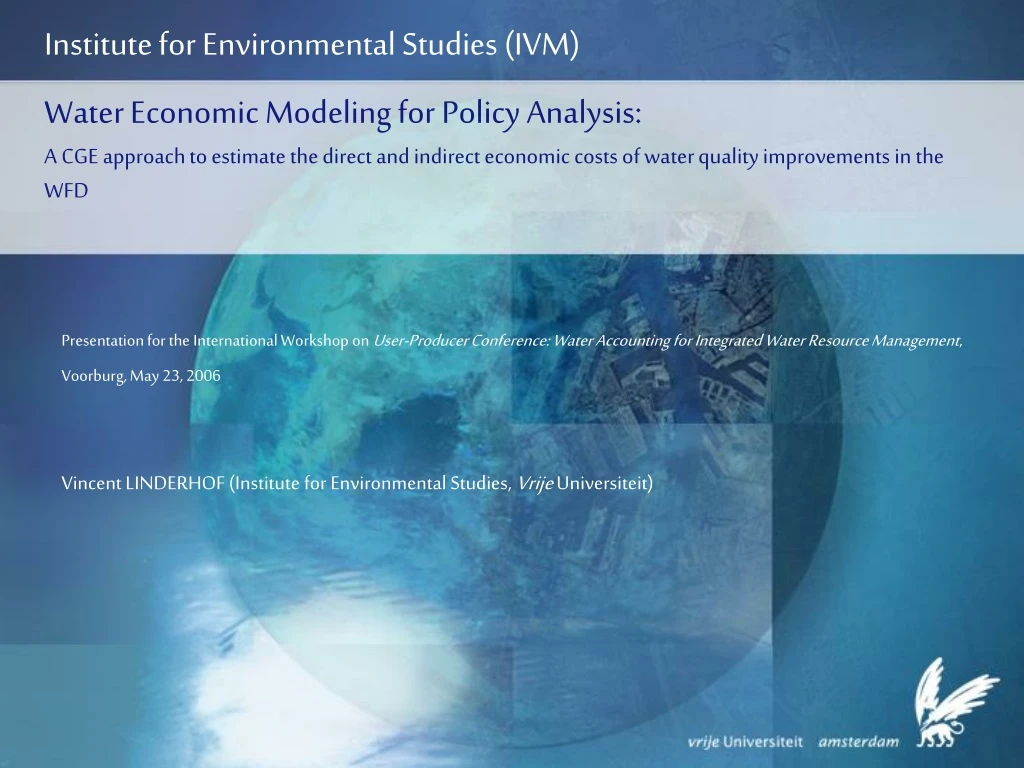
Institute for Environmental Studies (IVM). Water Economic Modeling for Policy Analysis: A CGE approach to estimate the direct and indirect economic costs of water quality improvements in the WFD.

E N D
Institute for Environmental Studies (IVM) Water Economic Modeling for Policy Analysis:A CGE approach to estimate the direct and indirect economic costs of water quality improvements in the WFD Presentation for the International Workshop on User-Producer Conference: Water Accounting for Integrated Water Resource Management, Voorburg, May 23, 2006 Vincent LINDERHOF (Institute for Environmental Studies, Vrije Universiteit)
Outline • Introduction WEMPA • AGE Model • Economy • Environment • Linkage • Data • Results (preliminary) • Potential and issues of the model
Introduction WEMPA • The ‘Directorate-General Water’ of the Ministry of Transport, Public Works and Water Management would like to have insight in direct and indirect economic costs of WFD measures. • Donors: • ‘Directorate-General Water’ and • Leven met Water (Living with water) • Participating organizations: • Institute for Environmental Studies (IVM), Vrije Universiteit • Agricultural Economic Research Institute (LEI) • Statistics Netherlands (CBS) • RIZA • WL Hydraulics
WEMPA Approach Modular approach Top-down modeling starting with economic model
WEMPA Approach Modular approach Top-down modeling starting with economic model Use of existing knowledge • Models (AGE-SNI, DEAN from IVM, Substance flow model from RIZA/WL) • Data (NAMWA and National Accounts from CBS, abatement technologies from experts)
Model • Integrated assessment model of IVM including the economy and physical flows. • Static Applied General Equilibrium (AGE) Model for the Dutch economy • Measures instant costs and losses in Net National Income • No technological changes over time • Objective: maximization of Net National Income subjected to environmental constraints
Model: economy • Static AGE model with 27 production sectors (38 or even 58) • Production structure: nested Constant Elasticity of Transformation/Substitution (CET/CES)
Model: economy • Static AGE model with 27 production sectors • Production structure: nested Constant Elasticity of Transformation/Substitution (CET/CES) • Three consumers: private households (luxury and subsistent consumption), government, the Rest of the World • Consumption structure: price and income elasticities given
Model: economy • Environmental sectors • Abatement sector: demand and supply of abatement technologies • Emissions and abatement enter production functions as inputs • Emission permits: demand and supply of emission permits given the total amount of emission permits based on the emission norms
Model: environment • NAMWA data from Statistic Netherlands • Two physical flows (environmental themes) • Eutrophication (NAMWA) • 10 kg N = 1 kg P = 1 Phosphor eq. • Dispersion of toxic substances to water (NAMWA) • 1 Aquatic Eco-Toxicity Potentials (aetp equivalents) equals • 6.3 kg Arsenic • 217.4 kg Chromium • 3.4 kg Cadmium • 3.2 kg Cupper • 3.6 kg Mercury • 0.3 kg Nickel • 666.7 kg Lead • 55.6 kg Zink
Model: environment • Input in model (NAMWA) • Emission intensity (per sector); • Abatement technologies (costs and reduction potential from experts); • Emission standards (will be derived from water quality standards)
Model: environment • Input in model (NAMWA) • Emission intensity (per sector); • Abatement technologies (costs and reduction potential from experts); • List of measures off which some are policy scenario based • Emission standards (will be derived from water quality standards) • All environmental themes are equal to or are less than the emission norm imposed • Interactions between environmental themes
Model: environment • Trade-off for meeting emission standards: • Investment in abatement technologies or • Costs of emission permits • If marginal costs > Marginal investment, then reduce economic activities and consequently reduce emissions Remark 1: if economic volume declines, the reduction potential of abatement technologies declines as well! Remark 2: high intensity sectors are likely to invest first, but this depends largely on the economic structure • Emission permits scheme • Amount of permits are determined by the emission norms • Revenues are recycled into the economy
Results (1) • Three scenarios: 10%, 20% and 50% reduction of emissions: the exact emission norms derived from WFD are yet unknown • Two variants • Variant I: No changes in relative world market prices • Variant II: Changes in relative world market prices • Results are very preliminary
Results (4) direct vs. indirect costs (preliminary) • “Direct costs” = Investments in abatement technologies • “Indirect costs” = Loss in Net National Income minus investments
Example of the distribution of direct and indirect costs across river basins for a 50% emission reduction scenario Rhine-West 51% Rhine-Centre 8% Rhine-East 11% Rhine-North 5% Scheldt 2% Meuse 20% Ems 3% Results (5) Regional impact (NAMWARiB)
Future improvements • Dynamic model (DEAN) • Substances instead of environmental themes • Sector-specific but generic abatement technologies • Regional distinctions but production sectors (growth expectations) • Extension of priority substances, such as POP’s, PCB’s and dioxines • No physical water flows
Thank you! • More information on our project Water economic mosdeling for Policy Analysis (WEMPA): • http://www.ivm.falw.vu.nl/watereconomics • Thank you!