Download
1 / 43
510 likes | 783 Vues
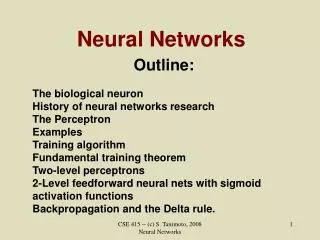
Evolutionary Neural Networks. Backgrounds. Why NN+EC?. “Evolving brains”: Biological neural networks compete and evolve The way that intelligence was created Global search Adaptation to dynamic environments without human intervention Architecture evolution. Optimal solution. Local Max.

E N D
Backgrounds Why NN+EC? • “Evolving brains”: Biological neural networks compete and evolve • The way that intelligence was created • Global search • Adaptation to dynamic environments without human intervention • Architecture evolution Optimal solution Local Max Initial weights Population Samples
Backgrounds General Framework of EANN [X. Yao]
Backgrounds Evolution of Connection Weights • Encode each individual neural network’s connection weights into chromosomes • Calculate the error function and determine individual’s fitness • Reproduce children based on selection criterion • Apply genetic operators
Backgrounds Representation • Binary representation • Weights are represented by binary digits • e.g. 8 bits can represent connection weights between -127 and +127 • Limitation on representation precision • too few bits → some numbers cannot be approximated • too many bits → training might be prolonged • To overcome binary representation, some proposed using real number • i.e., one real number per connection weight • Standard genetic operators such as crossover not applicable to this representation • However, some argue that it is possible to perform evolutionary computation with only mutation • Fogel, Fogel and Porto (1990): adopted one genetic operator –Gaussian random mutation
Backgrounds Evolution of Architectures • Encode each individual neural network’s architecture into chromosomes • Train each neural network with predetermined learning rule • Calculate the error function and determine individual’s fitness • Reproduce children based on selection criterion • Apply genetic operators
Backgrounds Direct Encoding • All information is represented by binary strings, i.e. each connection and node is specified by some binary bits • An N by N matrix can represent the connectivity with N nodes, where • Does not scale well since large NN needs a big matrix to represent
Backgrounds Indirect Encoding • Only the most important parameters or features of an architecture are represented. Other details are left to the learning process to decide • e.g. specify the number of hidden nodes and let the learning process decide how they are connected (e.g. fully connected) • More biologically plausible as it is impossible for genetic information encoded in humans to specify the whole nervous system directly according to the discoveries of neuroscience
Backgrounds Evolution of Learning Rules • Decode each individual into a learning rule • Construct a neural network (either pre-determined or randomly) and train it with decoded learning rule • refers to adapting the learning function, in this case, the connection weights are updated with an adaptive rule • Calculate the error function and determine individual’s fitness • Reproduce children based on selection criterion • Apply genetic operators
Two Case Studies • Evolving intrusion detector • Evolving classifier for DNA microarray data
Evolutionary Learning Program’s Behavior In Neural Networks for Anomaly Detection
Motivation (1) • Attacker’s strategy: Leading to malfunctions by using program’s bug • Showing different behavior compared to normal one • Anomaly detection • Learning normal program’s behavior from audit data • Classifying programs which show different behavior with normal one as intrusion • Adopted in many host-based intrusion detection system • System audit data and machine learning techniques • Basic security module (BSM) • Rule-based learning, neural network and HMM
Motivation (2) • Machine learning methods such as Neural network (NN) and HMM • Effective for intrusion detection based on program’s behavior • Architecture of classifier • The most important thing in classification • Searching for appropriate architecture for the problems is crucial • NN: the number of hidden neurons and connection information • HMM: the number of states and connection information • Traditional methods • Trial-and-error • Train90 neural networks[Ghosh99] It took too much time because the size of audit data is too large Optimizing architectures as well as connection weights
Related Works • S. Forrest (1998, 1999) • First intrusion detection by learning program’s behavior • HMM performed better than other methods • J. Stolfo (1997) : Rule-based learning (RIPPER) • N. Ye (2001) • Probabilistic methods: Decision tree, chi-square multivariate test and one order Markov chain model (1998 IDEVAL data) • Ghosh (1999, 2000) • Multi-layer perceptrons and Elman neural network • Elman neural network performed the best(1999 IDEVAL data) • Vemuri (2003) • kNN andSVM(1998 IDEVAL data)
The Proposed Method • Architecture • System call audit data and evolutionary neural networks
Generating neural networks with optimal architectures for learning program’s behavior Normal Behavior Modeling • Evolutionary neural networks • Simultaneously learning weights and architectures using genetic algorithm • Partial training: back-propagation algorithm • Representation: matrix • Rank-based selection, crossover, mutation operators • Fitness evaluation : Recognition rate on training data (mixing real normal sequences and artificial intrusive sequences)
H1 0.4 0.7 0.2 I1 H2 O1 0.5 0.1 0.7 H3 0.1 Input Node Connectivity Hidden Node Output Node Weight Representation Generation of Neural Network
H1 0.4 0.7 0.1 0.5 I1 O1 H2 0.5 0.4 H3 0.1 H1 0.1 0.2 0.2 H2 I1 O1 0.5 0.1 0.7 H3 Crossover (1) H1 0.4 0.7 0.2 I1 H2 O1 0.5 0.1 0.7 H3 0.1 Crossover H1 0.1 0.2 0.1 0.5 I1 H2 O1 0.5 0.4 H3
Crossover (2) Crossover
H1 0.4 0.7 Add Connection 0.2 I1 H2 O1 0.5 0.1 0.7 0.3 H3 0.1 H1 0.4 0.7 0.2 I1 H2 O1 0.5 0.1 H3 0.1 Mutation H1 0.4 0.7 0.2 I1 H2 O1 0.5 0.1 0.7 H3 0.1 H1 0.4 0.7 Delete Connection 0.2 I1 H2 O1 0.5 0.1 0.7 H3 0.1
Anomaly Detection (1) • 280 system calls in BSM audit data • 45 frequently occurred calls (indexing as 0~44) • Indexing remaining calls as 45 • 10 input nodes,15 hidden nodes (Maximum number of hidden nodes), 2 output nodes • Normalizing input values between 0 and 1 • Output nodes: Normal and anomaly
Anomaly Detection (2) • Evaluation value will rise up shortly when intrusion occurs • Detection of locally continuous anomaly sequence is important • Considering previous values • Normalizing output values for applying the same threshold to all neural networks • m: Average output value for training data, d: std
Experimental Design • 1999 DARPA IDEVAL data provided by MITLincoln Lab • Denial of Service, probe, Remove-to-local (R2L), User-to-root (U2R) • Main focus: Detection of U2R attack • Bearing marks of traces in audit data • Monitoring program’s behavior which has SETUID privilege • Main target for U2R attack
Experimental Design (2) • 1999 IDEVAL : audit data for 5 weeks • 1, 3 weeks (attack free) training data • 4-5 weeks test data • Test data includes totally 11 attacks with4 types of U2R • Setting of genetic algorithm • Population size: 20, crossover rate: 0.3 mutation rate: 0.08, Maximum generation:100 • The best individual in the last generation
Evolution Results • Convergence to fitness 0.8 near 100 generations
Learning Time • Environments • Intel Pentium Zeon 2.4GHz Dual processor, 1GB RAM • Solaris 9 operating system • Data • Login program • Totally 1905 sequences • Parameters • Learning for 5000epoch • Average of 10 runs
Detection Rates • 100% detection rate with 0.7 false alarm per day • Elman NN which shows the best performance for the 1999 IDEVAL data : 100% detection rate with3false alarms per day Effectiveness of Evolutionary NN for IDS
Results Analysis – Architecture of NN • The best individual for learning behavior of ps program • Effective for system call sequence and more complex than general MLP
Comparison of Architectures • Comparison of the number of connections between ENN learned for 100 generations using psprogram data and MLP • They have the similar number of connections • However, ENN has different types of connections and sophisticated architectures MLP ENN
Evolving Artificial Neural Networks for DNA Microarray Analysis
Motivation • Colon cancer : The second only to lung cancer as a cause of cancer-related mortality in Western countries • The development of microarray technology has supplied a large volume of data to many fields • It has been applied to prediction and diagnosis of cancer, so that it expectedly helps us to exactly predict and diagnose cancer • Proposed method • Feature selection + evolutionary neural network (ENN) • ENN : no restriction on architecture (design without human’s prior knowledge)
What is Microarray? • Microarray technology • Enables the simultaneous analysis of thousands of sequences of DNA for genetic and genomic research and for diagnostics • Two Major Techniques • Hybridization method • cDNA microarray/ Oligonucleotide microarray • Sequencing method • SAGE
Authors Method Accuracy (%) Feature Classifier Furey et al. Signal to noise ratio SVM 90.3 Li et al. Genetic algorithm KNN 94.1 Ben-Dor et al. All genes, TNoM score Nearest neighbor 80.6 SVM with quadratic kernel 74.2 AdaBoost 72.6 Nguyen et al. Principal component analysis Logistic discriminant 87.1 Quadratic discriminant 87.1 Partial least square Logistic discriminant 93.5 Quadratic discriminant 91.9 Related Works
Colon Cancer Dataset • Alon’s data • Colon dataset consists of 62 samples of colon epithelial cells taken from colon-cancer patients • 40 of 62 samples are colon cancer samples and the remaining are normal samples • Each sample contains 2000 gene expressionlevels • Each sample was taken from tumors and normal healthy parts of the colons of the same patients and measured using high density oligonucleotide arrays • Training data: 31 of 62, Test data: 31 of 62
Experimental Setup • Feature size : 30 • Parameters of genetic algorithm • Population size : 20 • Maximum generation number : 200 • Crossover rate : 0.3 • Mutation rate : 0.1 • Fitness function : recognition rate for validation data • Learning rate of BP : 0.1
EANN Predicted 0 (Normal) 1 (Cancer) Actual 0 (Normal) 9 2 1 (Cancer) 0 20 Sensitivity/Specificity • Sensitivity = 100% • Specificity = 81.8% • Cost comparison • Classifying cancer person as normal person > classifying normal person as cancer person
Architecture Analysis Whole architecture From input to hidden neuron
Architecture Analysis (2) Input to output relationship is useful to analyze Input to output Hidden neuron to output neuron Hidden neuron to hidden neuron