Download
1 / 16
160 likes | 334 Vues
Mileage-Based Transit Fares. Timothy Sweetser, FCAS Bay Area R Users Group October 2, 2013. Bay Area Rapid Transit (BART). Opened in 1972 Serves counties of San Francisco, Alameda, Contra Costa, and Northern part of San Mateo

E N D
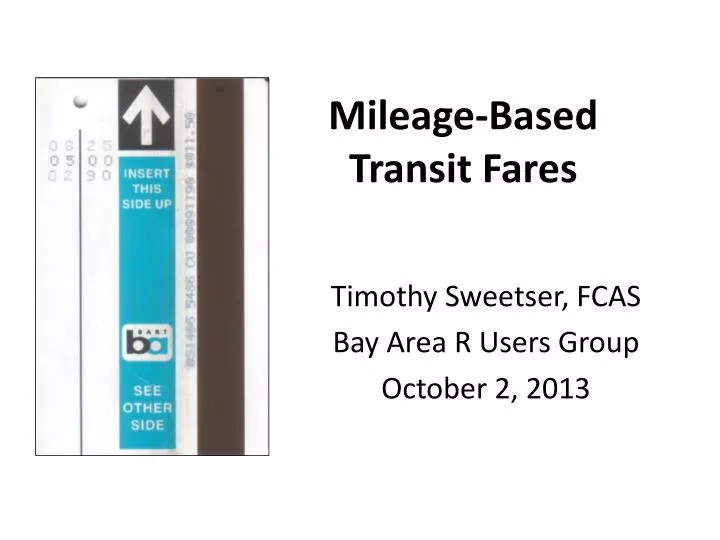
Mileage-Based Transit Fares Timothy Sweetser, FCAS Bay Area R Users Group October 2, 2013
Bay Area Rapid Transit (BART) • Opened in 1972 • Serves counties of San Francisco, Alameda, Contra Costa, and Northern part of San Mateo • Does NOT serve counties of Santa Clara, Marin, or the rest of San Mateo you are here
Bay Area Rapid Transit (BART) • “BART fares are set with a mileage-based formula, therefore time-based passes (e.g., weekly or monthly) are not available.” • http://bart.gov/tickets/index.aspx
Bay Area Rapid Transit (BART) • “BART fares are set with a mileage-based formula, therefore time-based passes (e.g., weekly or monthly) are not available.” • http://bart.gov/tickets/index.aspx • Let’s figure out the formula! For every trip, we need • The fare • Miles traveled
1. BART’s Fare Table This is an excerpt from http://www.bart.gov/docs/community_meetings/March_2012/1.4_fare%20table.pdf
Dataset • 44 Stations means =946 possible trips • Each row is one trip • For each trip, we have • Y = Fare from BART’s Fare Table • = Driving distance (miles) from Google Maps • Dummy variables: • = Airport • Transbay
Linear regression: Fare = 1.75 + * Miles + + Transbay + *Airport:Transbay
Linear regression: Fare = 1.75 + * Miles + + Transbay - 0.52*Airport: Transbay
TransBaycomes from geocoding each station, and then seeing if the trip begins/ends on different sides of the Bay Thanks to Statisfaction Blog for the geocode functions http://statisfaction.wordpress.com/2011/10/05/calling-google-maps-api-from-r/
Model Residuals = Actual Fare – Predicted Fare Residual = Actual - Predicted
Linear regression: Fare = 1.75 + * Miles + + Transbay - 0.52*Airport: Transbay
Applications • New Stations • Warm Springs, San Jose, Santa Clara • Pittsburgh, Antioch, Oakley, Brentwood • Livermore • Oakland Airport Connector (2014)
Applications • New Stations • Warm Springs, San Jose, Santa Clara • Pittsburgh, Antioch, Oakley, Brentwood • Livermore • Oakland Airport Connector (2014) • Comparison of marginal costs: 9 cents per mile vs… • Driving • Other transit systems
DC Metro System • DC charges higher fares during “peak times” • Miles are provided by Washington Metropolitan Area Transit Authority • Read about it on • https://sites.google.com/site/tsweetser/dc-metro-project