Download
1 / 17
180 likes | 285 Vues
Texting while Driving. Content. Table of Content Demographics Questions Graphs Conclusions Recommendations. Demographics. Response Rate: 16 out of 20 Students Participants: 16 participants Age: 18-21 years of age Mean: 19 Median: 19 Mode: 19 and 20 Range: 3

E N D
Content • Table of Content • Demographics • Questions • Graphs • Conclusions • Recommendations
Demographics Response Rate: 16 out of 20 Students Participants: 16 participants Age: 18-21 years of age Mean: 19 Median: 19 Mode: 19 and 20 Range: 3 Gender: 12 Female & 4 Male Academic Discipline: Race/Ethnicity: Asian-.036% White/Caucasian- 75% Latino- .063% Pacific- .063% Experience:
Questions Summary & write-up of a certain amount of questions taken from the survey.
Question One • Question: What is your gender? • Google Summary • Analysis Write-Up: What is your gender? • Most of the participants were female, there was about twelve with four male.
Question Two • Question: What is your age? • Google Summary • Analysis Write-Up: What is your age? • The participants were between 18-21 years of age: 4-18 years, 5-19 years, 5-20 years, and 2-21 years.
Question Three • Question: What is your race/ethnicity? • Google Summary • Analysis Write-Up: What is your Race/Ethnicity? • We had different participants with different background, like 1 Asian, 12 White/Caucasion, 1 Latino/a, and 1 American and 1 Pacific.
Question Four • Question: What state are you originally from? • Google Summary • Analysis Write-Up: What state are you originally from? • Most of the participants were from Arizona; 9 Arizona, 2 California, 1 Ohio, 1 Illinois, 1 Maryland, 1 Florida, and 1 Texas.
Question Five • Question: Do you have a cell phone? • Google Summary • Analysis Write-Up: Do you have a cell phone? • Each participate ALL have cell phones.
Question Six • Question: Do you have a car or a license? • Google Summary • Analysis Write-Up: Do you have a car or a license? • Looking at the outcome, 12 participants have answered yes to having either a car or a license and 4 answered no.
Question Eight • Question: Have you ever sent a text while driving? • Google Summary • Analysis Write-Up: Have you ever sent a text while driving? • ALL the participants have agreed and answered yes.
Graphs We have chosen these 3 questions to be represented by different kinds of graph.
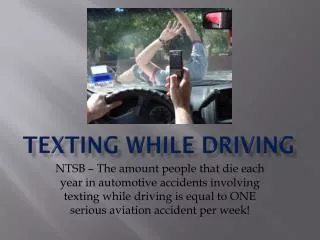
Conclusion Many of the participants have admitted that they have texted on their phones while driving. More than half the class has agreed that young adults, like themselves, feel safe texting while driving. It is concluded that many young adults are in a situation where breaking the law is becoming a habit in their lives. When a person texts while driving, it is at a high average for that person to be involve in an accident either injuries occur or worst.
Recommendations • After reviewing the data, our team recommends to alter business practices in order to integrate more telecommuter work assignments. We do not want people to go without being informed of the risk of texting while driving and what it may cause. • BrinliKee, Sarah Murray, Tori Duplisse